Replies: 2 comments 3 replies
-
|
Since the breakpoints are based per file, will there be an option to turn off rather than remove all breakpoints in a file? |
Beta Was this translation helpful? Give feedback.
-
|
After several weeks of discussion, the Breakpoint redesign RFC is now closed. While the comments seems inactive here, we receive quite some feedback on our @ChromeDevTools Twitter. Based on the feedback and the initial prototype, we plan to move forward with the proposed design. We’ll provide more updates as we progress with the implementation and incorporate your feedback, so stay tuned! In particular, a couple action items stand out:
There are other UX improvement feedback as well, we’ll consider adding them, possibly in follow-up releases. We will fix some implementation issues uncovered by participants. Thanks to all the participants for your help evolving Chrome DevTools! |
Beta Was this translation helpful? Give feedback.
-
Author: Kim-Anh Tran (@ktran), Jecelyn Yeen (@jecfish)
Posted: Dec 19, 2022
Status: Complete
Chrome bug tracker: https://crbug.com/1394686
The goal of this RFC is to validate the design with the community, solicit feedback on open questions.
Complete: This RFC is now complete. See a summary here.
Motivation
The current Breakpoints pane provides little visual aid in overseeing all breakpoints. On top of that, frequently used actions are hidden behind the context menu.
With our redesign we want to bring structure into the Breakpoints pane and allow developers to have quick access to commonly used features, in particular editing and removing breakpoints.
Goals and Non-Goals
Goals:
Non-Goal:
What’s changed? Try the prototype
The prototype is available from Chrome 109 onward. Turn on the experimental flag to give it a try. To check your current browser version, type
chrome://versionin your address bar. (Install Chrome Canary, Dev or Beta to test if your current browser version is lower than 109)Click on the Settings icon > Experiments tab > enable the Enable re-designed Breakpoint Sidebar Pane in the Sources Panel.
Below are the changes:
Questions for Discussion
In addition to general feedback, we would like to collect feedback on the following specific questions:
We are interested in any workflows that we haven’t considered when redesigning the sidebar. Let us know if the old sidebar supported a workflow which the new one doesn’t!
FAQ
How can I try out the new Breakpoints pane?
It is available in Chrome 109. Turn on the experimental flag to give it a try. To check your current browser version, type
chrome://versionin your address bar.Consider using the Chrome Canary, Dev or Beta as your default development browser. These preview channels give you access to the latest DevTools features!
When is the new Breakpoints pane becoming the default one?
We plan to turn on the experiment per default with Chrome 111. You will still be able to switch back to the old Breakpoints pane if you wish so until (including) Chrome 112. With Chrome 113, we will remove the old Breakpoints pane.
Does this new design apply to setting breakpoints in NodeJS applications?
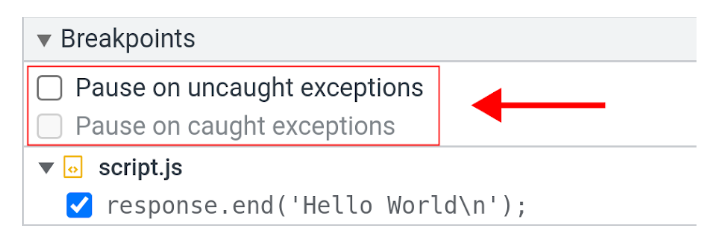
It works mostly the same, except a slight difference in Pausing on exceptions for Node. Pausing on caught exceptions will only be possible if you pause on uncaught exceptions too. See Chromium bug #1382762 for details.

Beta Was this translation helpful? Give feedback.
All reactions