Replies: 18 comments 37 replies
-
|
@joyeecheung @mhdawson @mcollina @jasnell @gireeshpunathil @Qard FYI |
Beta Was this translation helpful? Give feedback.
-
|
@jrieken @bartlomieju fyi |
Beta Was this translation helpful? Give feedback.
-
|
@RafaelGSS fyi |
Beta Was this translation helpful? Give feedback.
-
|
Nice write-up of the new performance panel! I am wondering, is the Node.js-dedicated panel going to remain in Also, I gave it a try and profiled a typical HTTP server: 'use strict';
const http = require('http');
const bodyLength = 12345;
const body = 'c'.repeat(bodyLength);
const server = http.createServer(function(req, res) {
res.writeHead(200, {
'Content-Length': bodyLength,
'Content-Type': 'text/plain'
});
res.end(body);
});
server.listen(0, '127.0.0.1', () => {
const { address, port } = server.address();
console.log(`http://${address}:${port}`);
});And profiled it with: Here is the comparison (the workload in the particular span that the profile is taken differed slightly so minor differences in the calculations can be ignored): Close-up looks of some frames: Other than the
|
Beta Was this translation helpful? Give feedback.
-
|
A use case I have been using is to collect CPU and memory profiles using the inspector API directly and then loading them up in chrome to visualize them. Given the format has changed, will this still be supported? |
Beta Was this translation helpful? Give feedback.
-
|
Seems to not handle large profiles as well as the old Profiler tab. I opened a ~25mb profile in the Profiler tab which loaded and displayed fine and could be navigated relatively smoothly with only a little bit of lag. I loaded the same profile in the Performance tab and it seemed to lock up while loading, eventually displaying the thing after several minutes. When I tried to click anything in the chart visualization it crashed the whole browser. 😬 |
Beta Was this translation helpful? Give feedback.
-
|
Hi @jecfish, I'm gonna need one or two more days to provide my feedback - thanks to your example I discovered that Deno's console implementation if missing some console methods that should be available in the inspector. |
Beta Was this translation helpful? Give feedback.
-
|
Hi all, Happy New Year! Thanks for your testing and feedback. @lilysjtu2011 has made a couple of significant improvements based on your feedback. Please give it another round of test in Canary and comment! Below are the improvements:
Looking forward to your feedback on this new workflow! |
Beta Was this translation helpful? Give feedback.
-
|
Hi all, We appreciate your valuable testing and feedback thus far. With all blocking issues addressed, we are currently in the process of deprecating the JS Profiler, which involves 4 stages:
If you come across any issues during this process, please do report them to us. Regards, |
Beta Was this translation helpful? Give feedback.
-
|
The old JS Profiler allows fairly easy access to the most time consuming functions and even lines of code. |
Beta Was this translation helpful? Give feedback.
-
|
There's two things I would sorely miss if we deprecate JS profiler:
|
Beta Was this translation helpful? Give feedback.
-
|
How to select a VM instance in Performance panel? Currently it is possible to select an iframe or web-worker in Profile tab. |
Beta Was this translation helpful? Give feedback.
-
|
Are there any types of targets that aren't supported by the Performance panel that are by the older Profiler tab? Currently, the profiler tab works for me, but when I try to record a profile in the Performance panel I get "Performance trace recording not supported by this type of target". |
Beta Was this translation helpful? Give feedback.
-
|
The Performance tab is significantly slower (as previously noted #2 (comment)), consumes a ton of CPU for complex profiles, and yesterday it crashed several times while trying to load the output from a fairly long-running profile - I couldn't even download the profile before the Performance tab became unresponsive, so I had to re-run it and take small (sub 90s) profiles multiple times, for the duration of the task. That is, of course, very inconvenient - re-enabled the Profiler tab because of this. |
Beta Was this translation helpful? Give feedback.
-
|
JS Profiler works on big projects (games) no matter how long you profile it for. Performance tab just dies after you stop it past more than 5 seconds of profiling within same project (without screenshots or anything else pretty much). But interestingly profiling with JS Profiler and then exporting/importing same file via Performance tab does work fine too. |
Beta Was this translation helpful? Give feedback.
-
|
Hi, I am trying to debug a node application it used to work fine with JS Profiler but with Performance tab it just dies after couple of seconds. Also when starting the profiling in performance tab it stops the task initiated with Chrome Version 114.0.5735.199 (Official Build) (64-bit) |
Beta Was this translation helpful? Give feedback.
-
|
The old profiler immediately opens the linked source code when you click a block in the flamechart. Currently we have to separately click the source link in the bottom drawer, which is pretty far from the flamechart, and if we switch the tab in the drawer to investigate the block we'll have to return to the Summary tab again, constantly switching tabs is inconvenient. |
Beta Was this translation helpful? Give feedback.
-
|
After almost a year of discussion, we're closing the RFC for using the Performance panel for Node.js/Deno JavaScript CPU profiling. As previously communicated, we're currently in stage 3 of the 4-stage JS Profiler deprecation. In upcoming releases, we'll remove the JS Profiler entirely once all blocking issues are resolved. Blocking Issues
Follow ups There are other UX improvement suggestions as well, we’ll consider adding them, possibly in follow-up releases. If you have any questions or feedback, please share them at crbug.com/1354548. We would like to thank everyone for your feedback and for your help in shaping Chrome DevTools! |
Beta Was this translation helpful? Give feedback.
-
Author: Nancy Li (@lilysjtu2011), Jecelyn Yeen (@jecfish)
Posted: Nov 9, 2022
Status: Complete
Chrome bug tracker: https://crbug.com/1354548
The goal of this RFC is to validate the design with the community, solicit feedback on open questions, and enable experimentation via a non-production-ready prototype included in this proposal.
Complete: This RFC is now complete. See a summary #2 (comment).
Motivation #
Since Chrome 58, the DevTools team set a long-term goal to deprecate the JavaScript Profiler (Profiler tab), and migrate Node.js and Deno developers to use Performance panel for profiling JavaScript CPU performance.
These changes allow users to profile performance consistently with one single entry point - the Performance panel.
Goals #
Profile Node.js / Deno JavaScript CPU performance with Performance panel
Minimize impact on the ecosystem
Current state #
Here is the current workflow on profiling JavaScript CPU performance:
Run
node --inspect file-name.jsordeno --inspect file-name.js(e.g. use this example file)Open DevTools for Node via one of these options:
chrome://inspect> Devices > click Open dedicated DevTools for Nodechrome://inspect> Remote target > click InspectStart and end profiling by clicking the
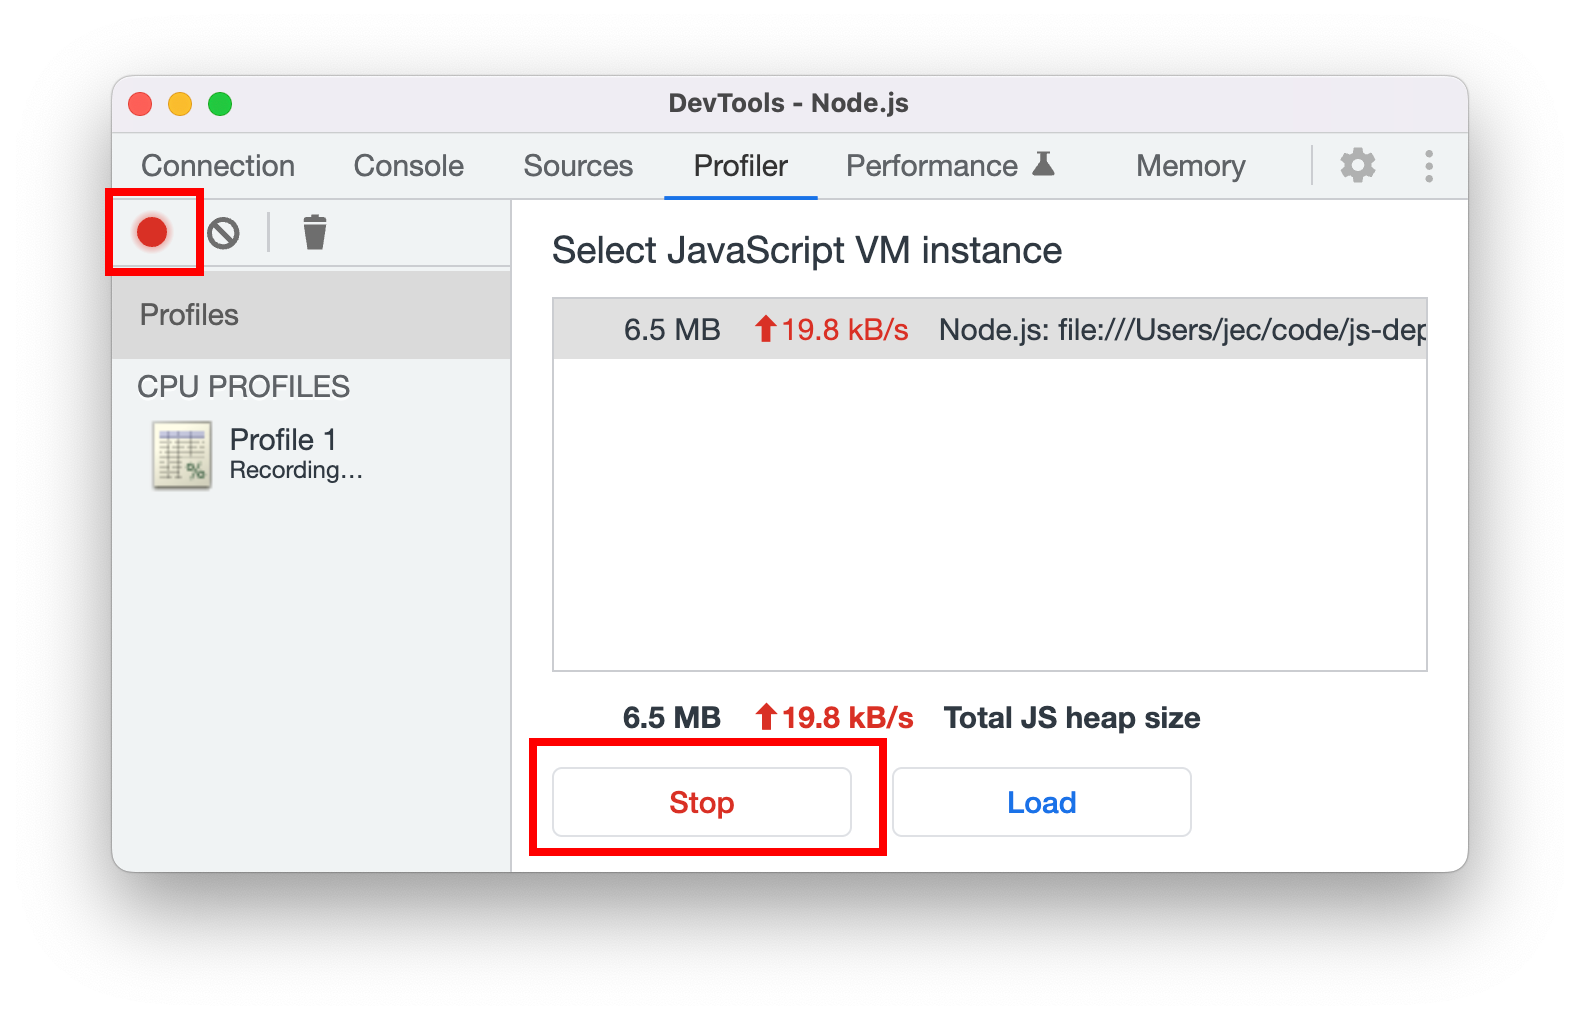
Recordbutton in the Profiler tab.View the result in the Profiler tab. Use the dropdown to switch to different views. It support 3 modes currently :
Chart


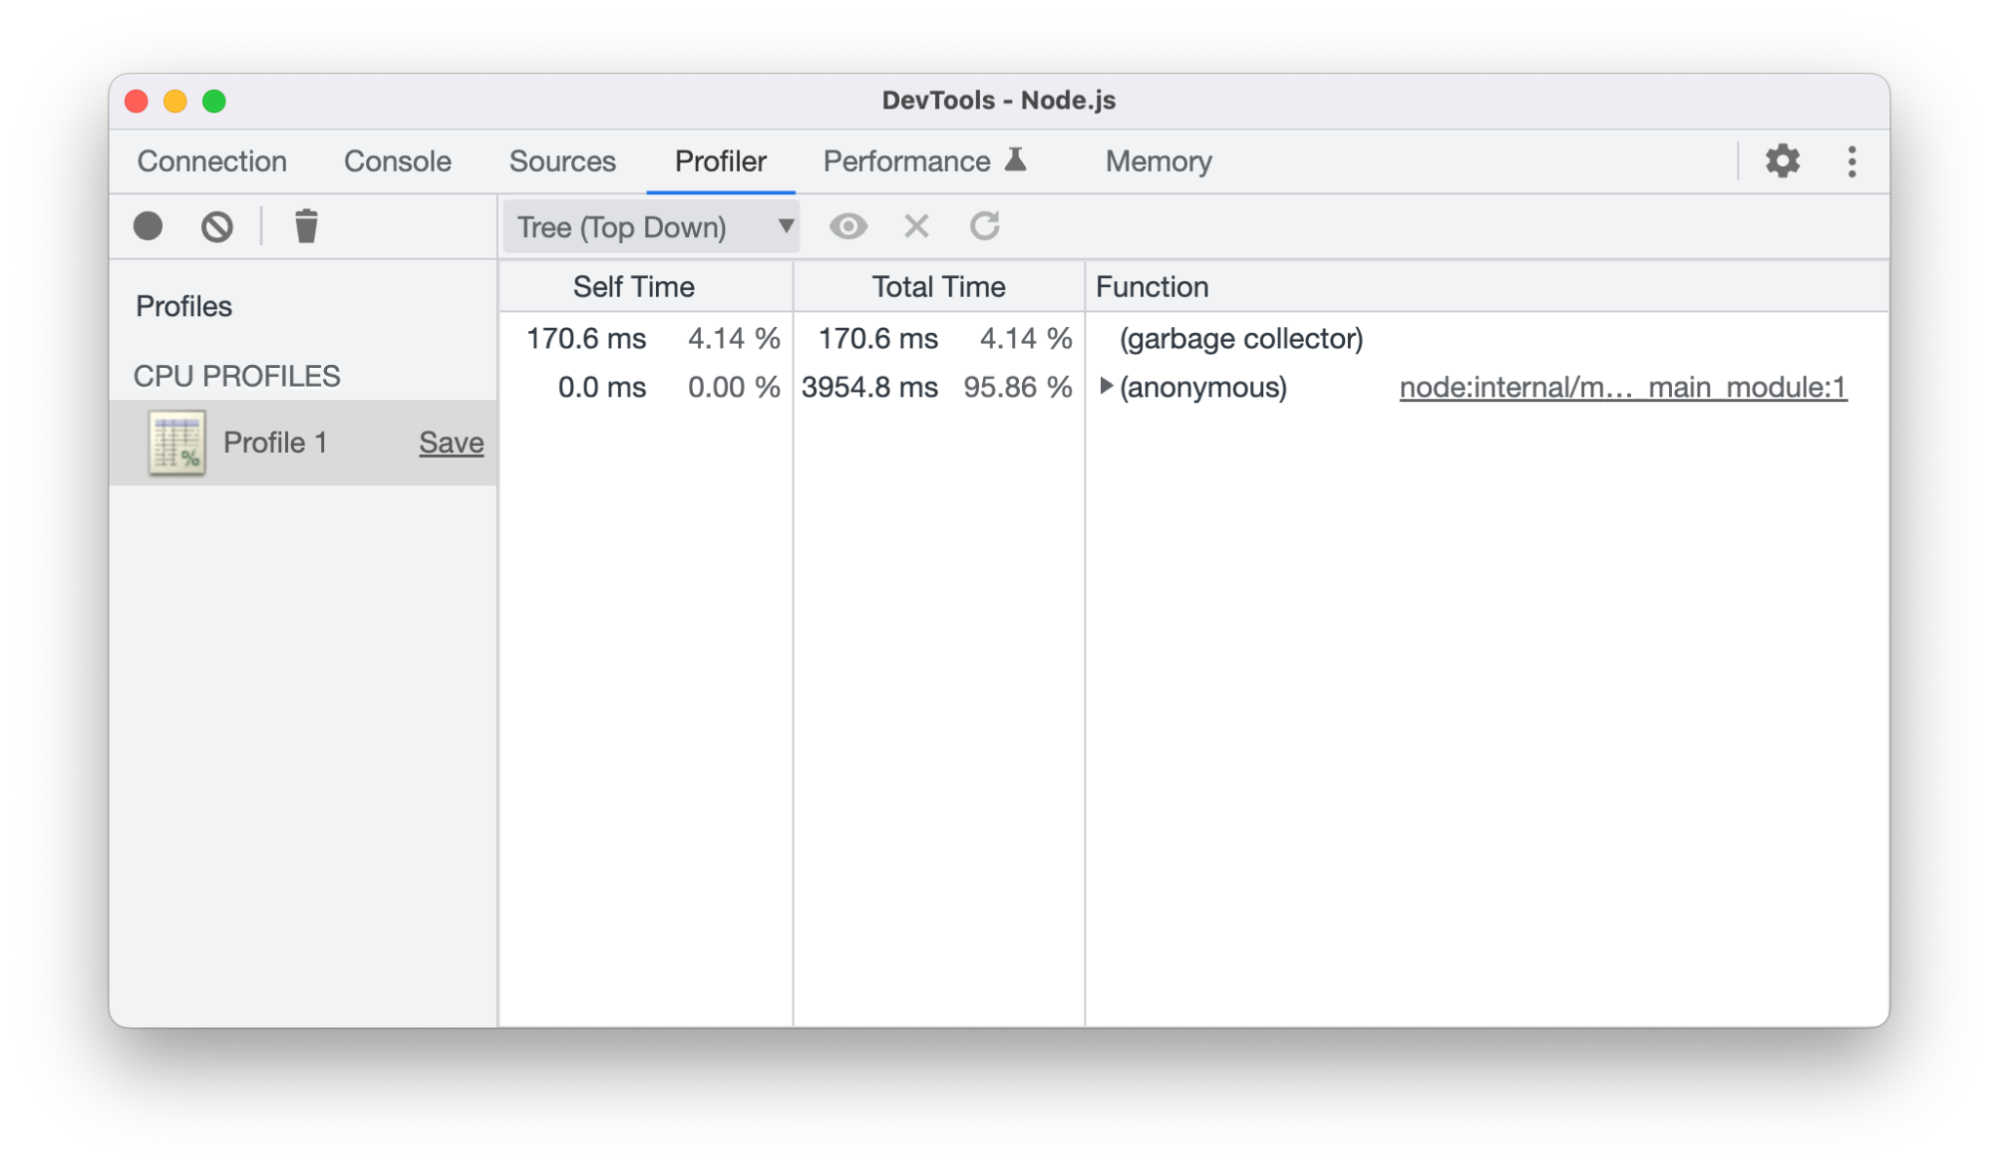
Heavy (bottom up)
Tree (top down)
Try the prototype: Profile using the Performance panel #
There is a prototype implementation. Below, we show a guide for trying it out. This is a draft implementation, with missing features and non-final design aspects.
Please use Chrome Canary to play with the prototype.
Profiling with the Record button
Run
node --inspect file-name.jsordeno --inspect file-name.jsOpen DevTools for Node. (Chrome Canary)
Open the Performance panel via the 3-dot menu > More tools > Performance panel. This step is not required once the changes are rolled out officially, the Performance panel will show by default.

Start and end profiling by clicking the
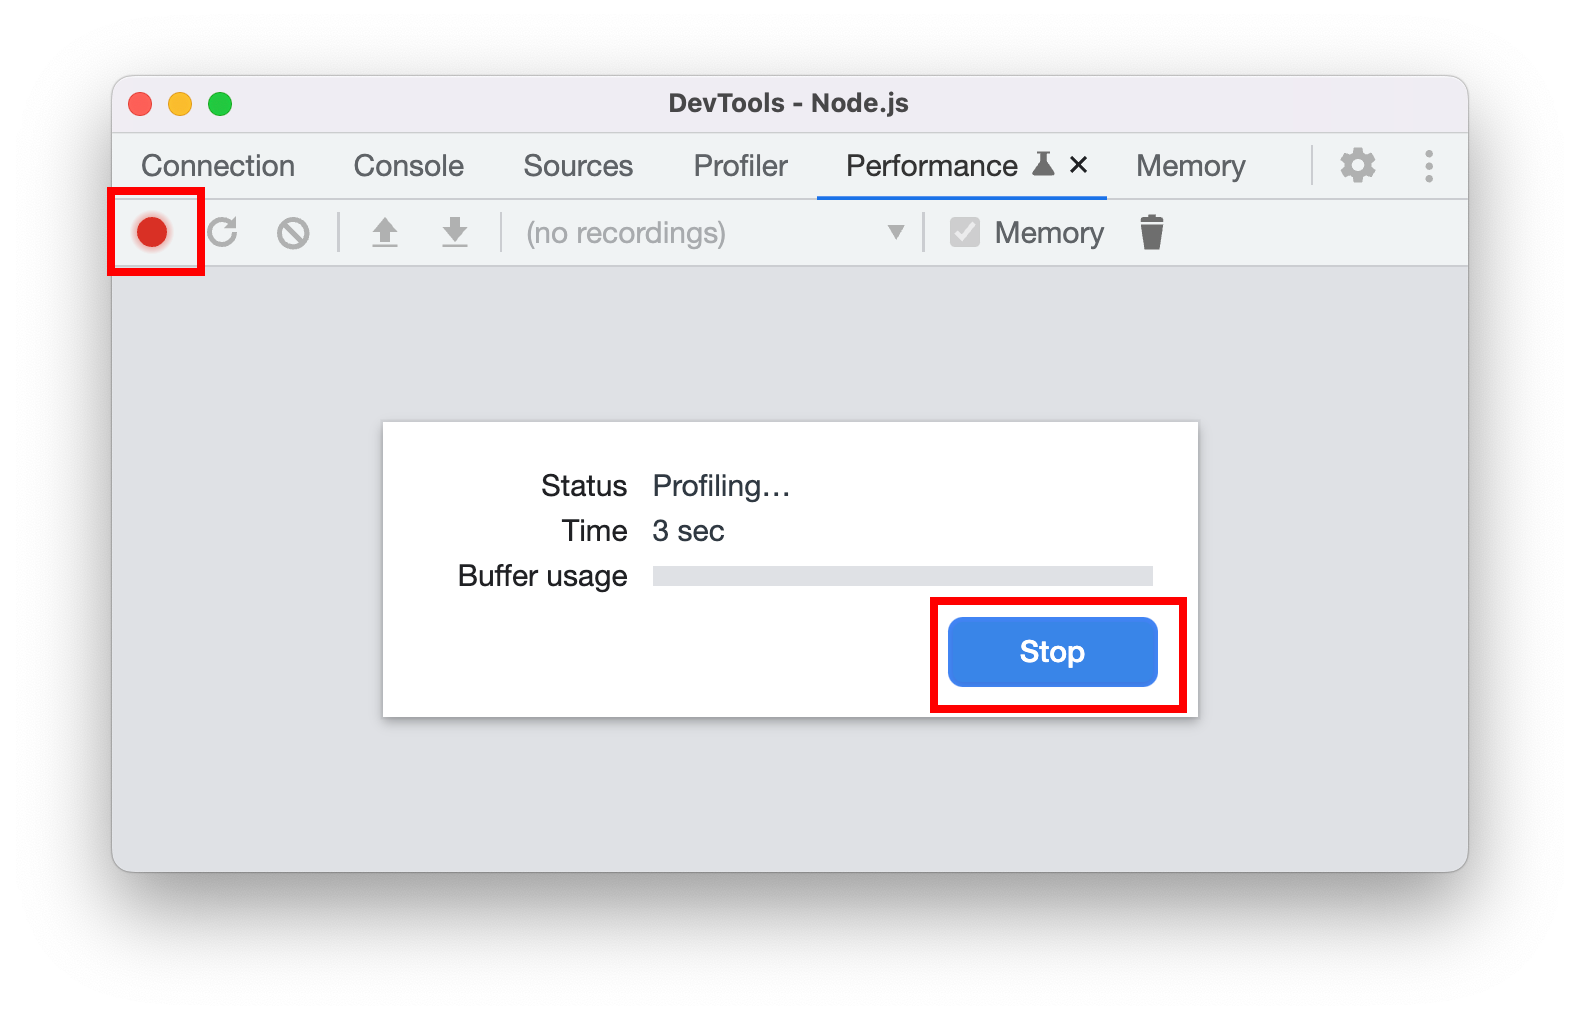
Recordbutton in the Performance panel.View the result in the Performance panel. The UI is different from the Profiler tab but you can find all the information:
Chart
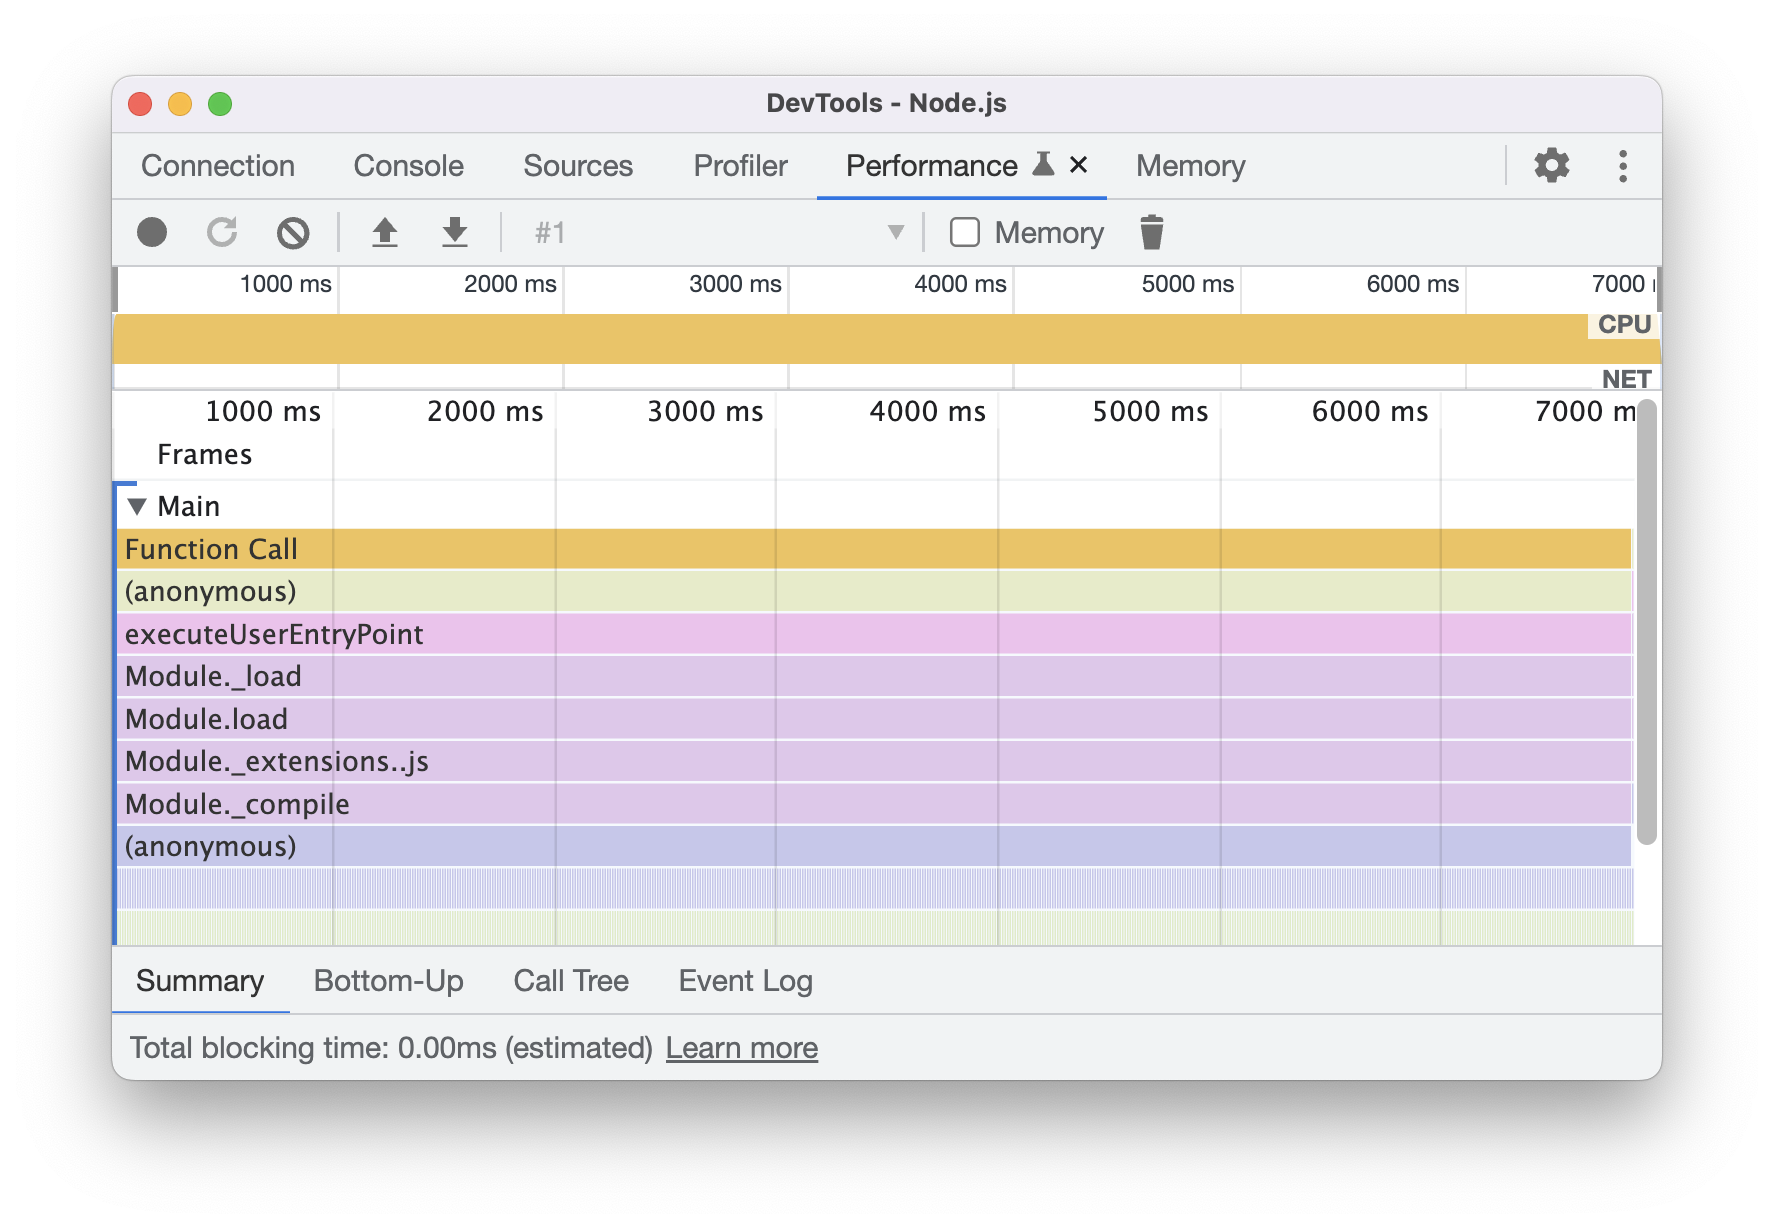

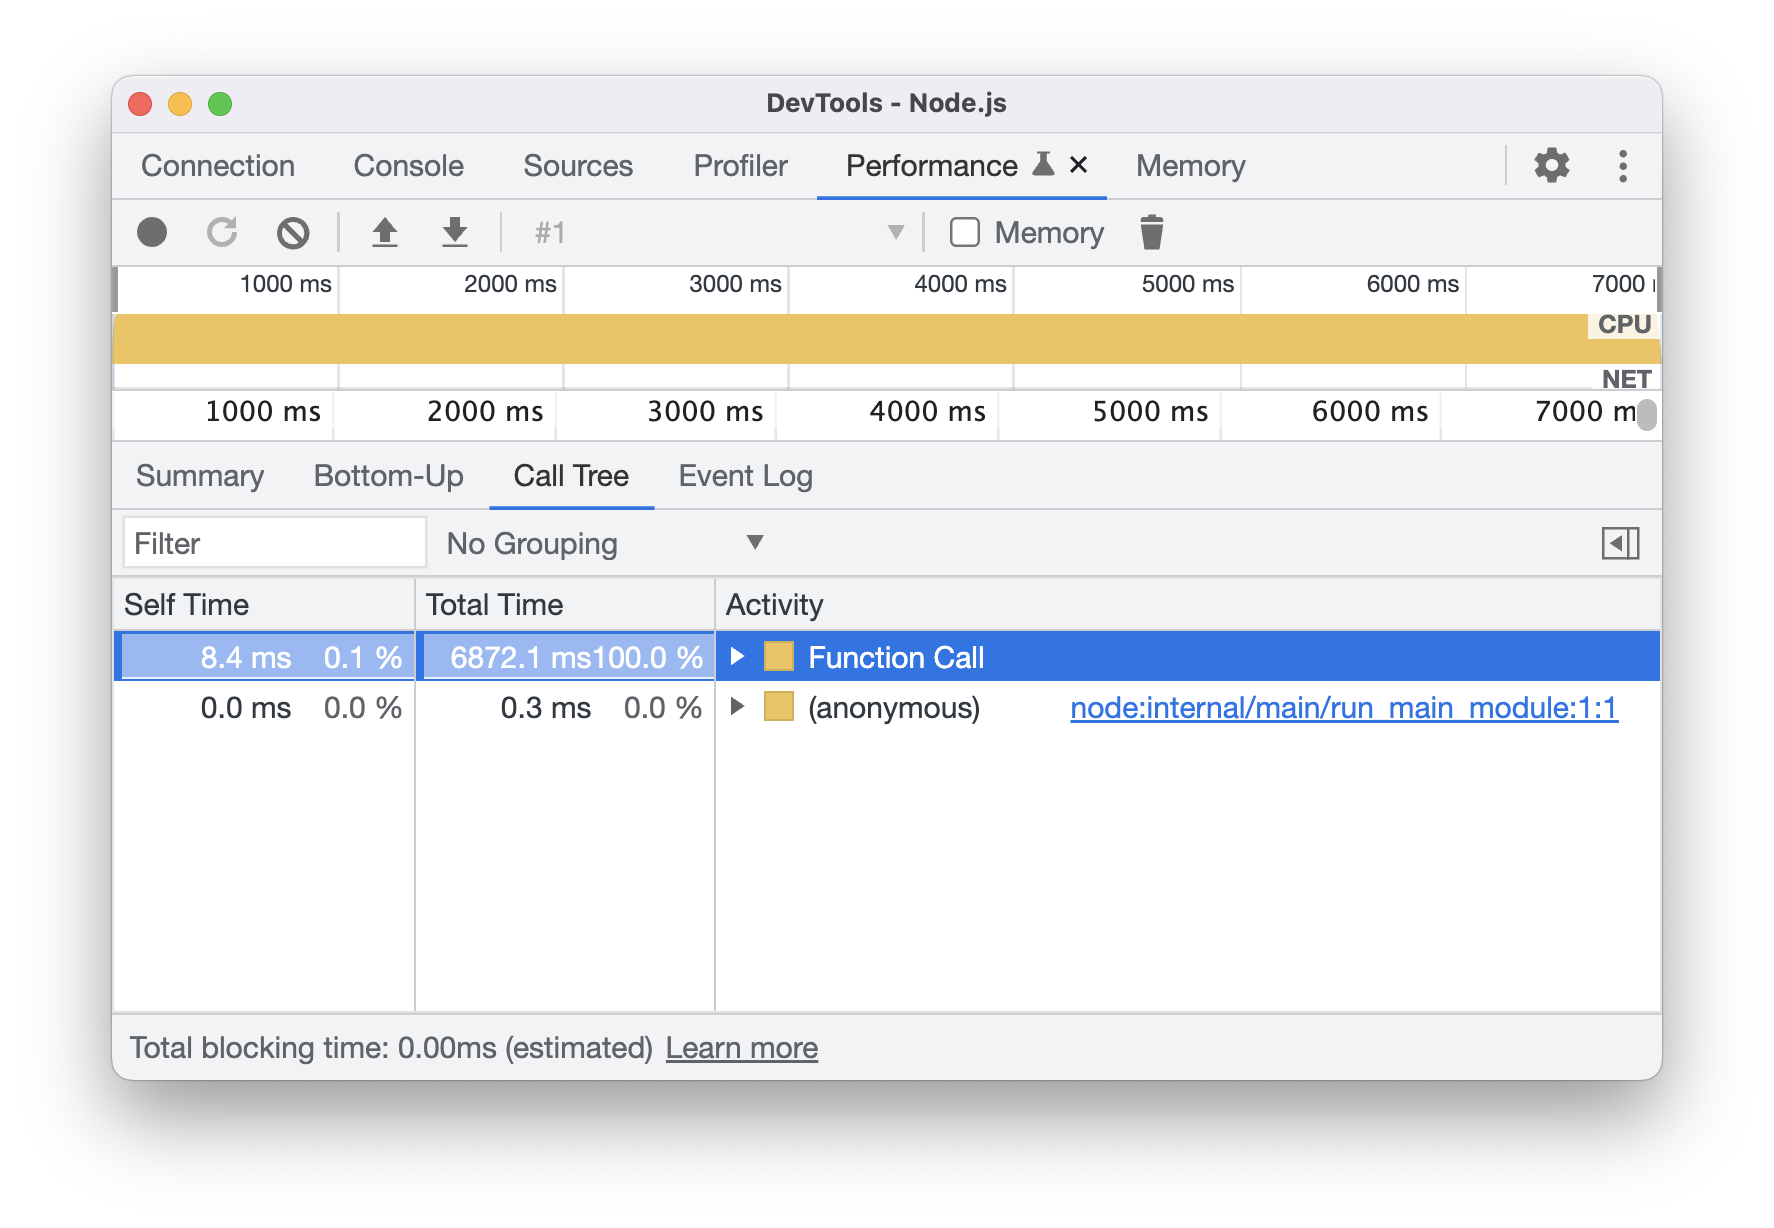
Bottom-up
Call tree
Profiling with the console.profile() command
If you profile performance with the
console.profile()command, you need to enable an experiment to map the result to the Performance panel.node --inspect file-name.jsordeno --inspect file-name.js(e.g. use this example file)FAQ #
What will happen with the Profiler tab in the future? Will that be deprecated / removed?
Yes, we plan to deprecate the Profiler tab by stages. We will look into community feedback, and implement the JavaScript profiling capability into the Performance panel before deprecation.
Can I load the CPU profile I saved in the Profiler tab previously into the Performance panel?
Yes. You can import
.cpuprofilefiles to the Performance panel.Are both Profiler tab and Performance panel using the same data source?
Yes. The backend data source is the same for both. However, there are frontend logics that change the displayed data in the Profiler tab.
Below are the same profiling results shown in the Profiler tab and Performance panel.
There are
31 known differences at the moment:a. From showing frames directly to organizing them under call stack - In the above example, the Profiler shows
executeUserEntryPointand theModuleframes straight away. On the other hand, the Performance panel organizes them under the same call stack, you need to expand them to view it.b.
crbug.com/1382733 (Fixed) - Some frames like(garbage collector)are hidden now in the Performance panel. We are working on adding them.c.
crbug.com/1080918 (Fixed) - Differences in profilingsetTimeoutcall due to the stack trace collection. We are working on addressing this.Where is the realtime total JS heap size view?
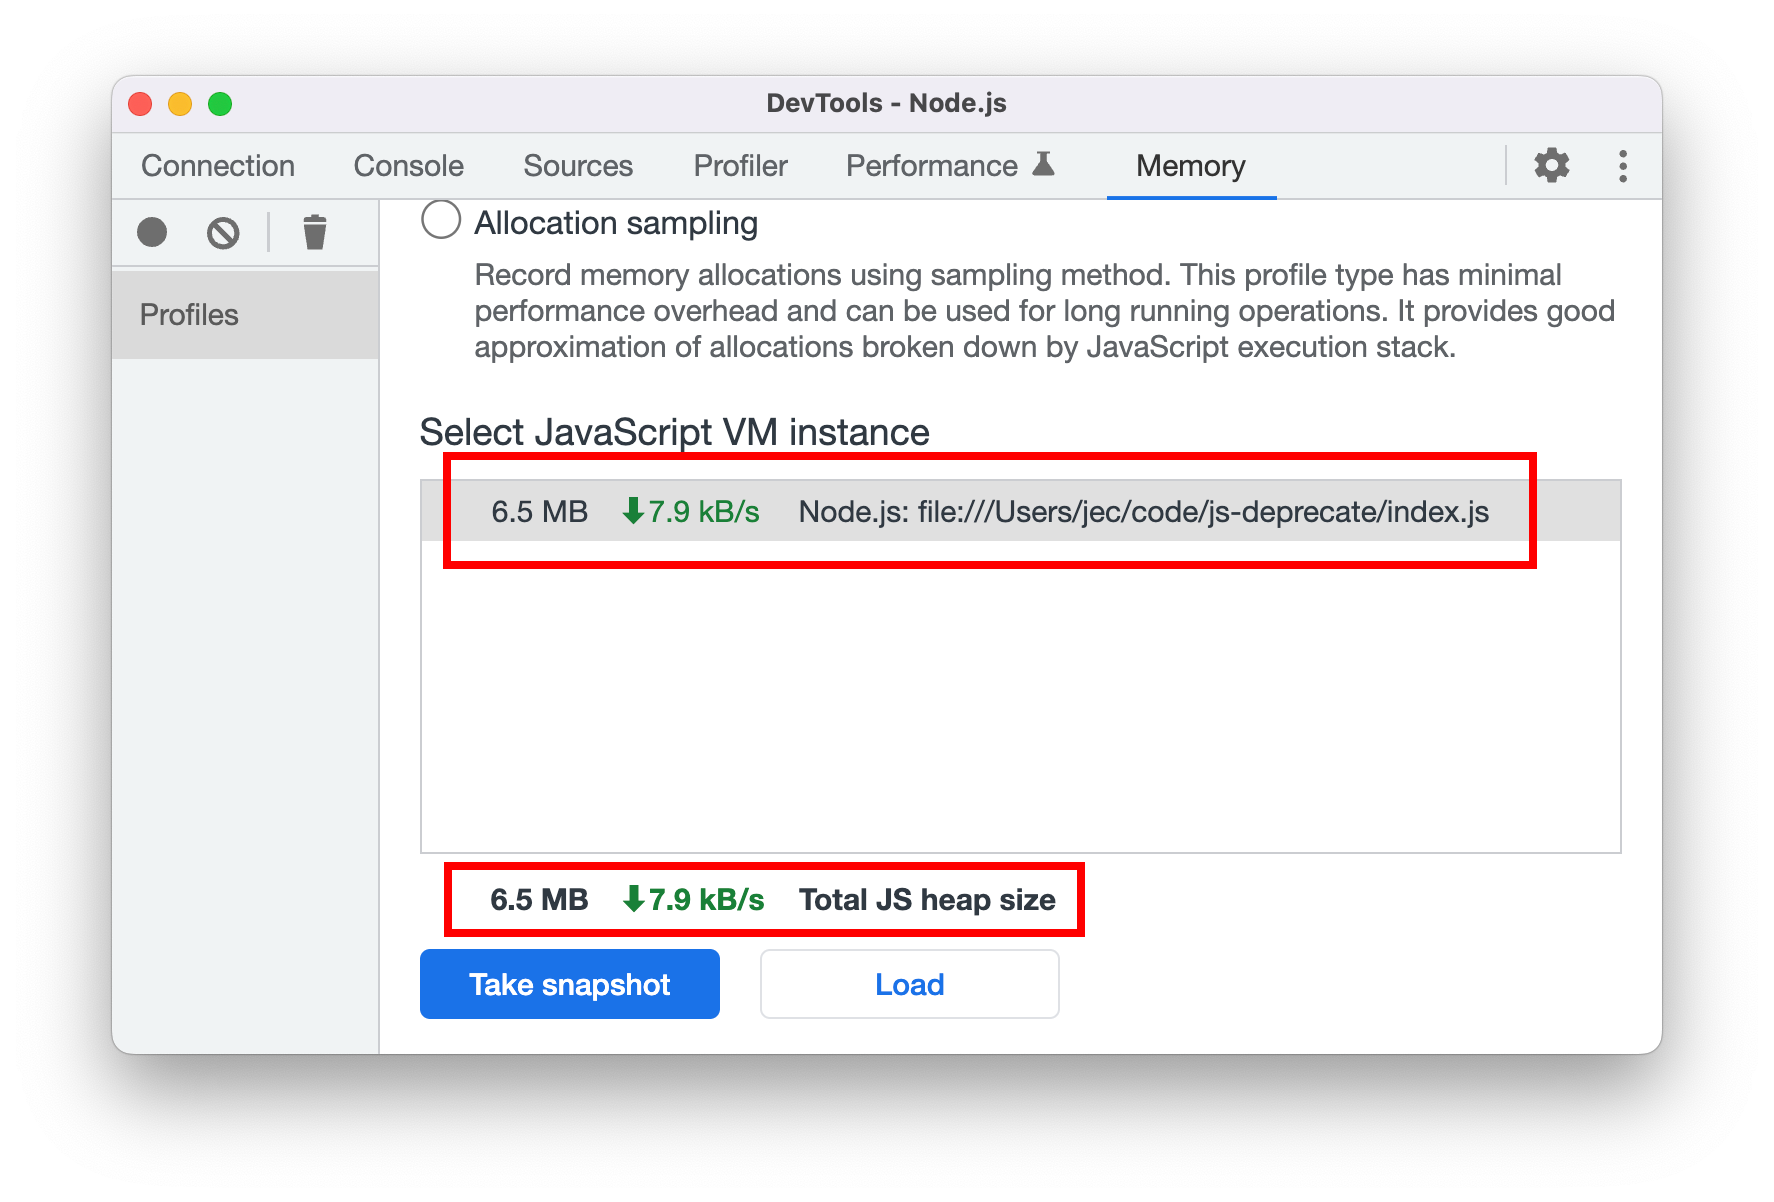
The realtime Total JS heap size information is already available in the Memory panel. There is no plan to move that into the Performance panel.
The realtime total JS heap size in the Memory panel
Does the Performance panel support reload and record Node.js / Deno performance?
No. This proposal focuses on migrating the existing features in the Profiler tab to the Performance panel. The Profiler tab doesn’t support reload and record.
Questions for Discussion #
In addition to general feedback, we would like to collect feedback on the following specific questions:
Does the prototype correctly display JavaScript profiling information?
We are interested in any cases where the information is missing or has discrepancy with the Profiler tab.
Does profiling in the Performance panel UI work well for you?
We would be interested in any use cases where this change in UI would be problematic or burdensome, and where the UI is important.
For example, should we enlarge the Bottom-up tab and show it by default when you open the Performance panel in Node.js / Deno mode?
Beta Was this translation helpful? Give feedback.
All reactions