SUI Rejected At Key Resistance After Explosive RallyExplosive Breakout Into Resistance
SUI produced a powerful breakout rally this week, surging aggressively into the major $1.35 resistance region before finding sellers. Price eventually topped out around the recent $1.42 swing high.
Pullback Currently Looks Controlled
Despite the rejection, the

The best trades require research, then commitment.
Get started for free$0 forever, no credit card needed
Scott "Kidd" PoteetPolaris Dawn astronaut

Where the world does markets
Join 100 million traders and investors taking the future into their own hands.

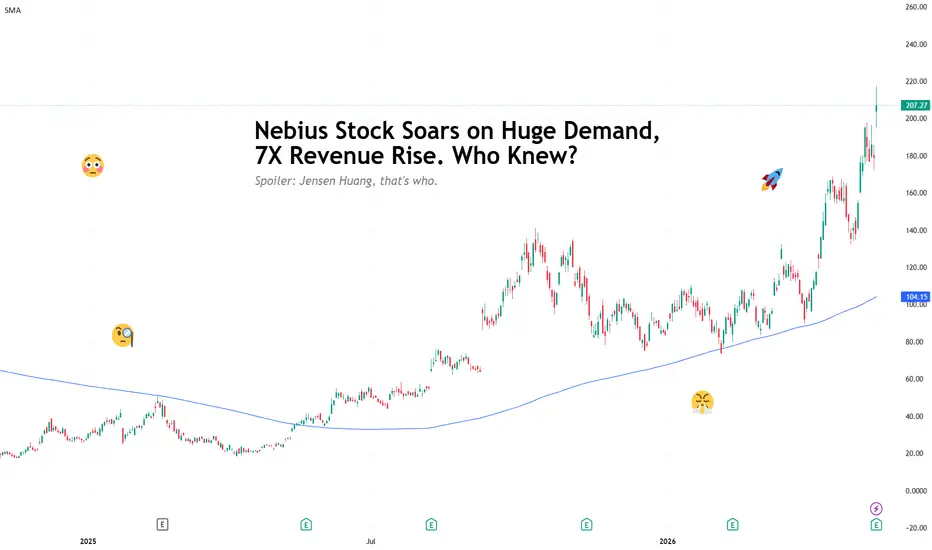
Nebius Stock Soars on Huge Demand, 7X Revenue Rise. Who Knew?Jensen Huang knew. That’s who. And he told you.
A few months ago many traders didn’t know what Nebius NASDAQ:NBIS was. Others looked at the stock and most likely thought: “Interesting, I'll wait for the drop.”
Fast forward to now, and the stock has turned into one of the market’s hottest AI in
ASX 200 - Swing Low In Place?I've been keeping a close eye on the ASX 200 for a potential swing low on the daily chart. With any luck, it was seen yesterday.
MS.

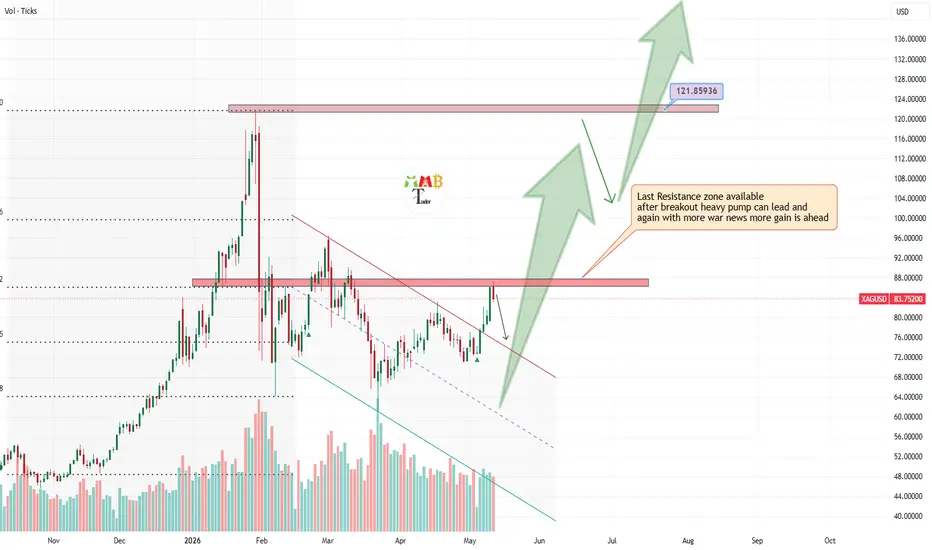
Silver needs to hit 140$ this yearCurrent Market Structure:
Silver has successfully broken above a significant multi-period falling trendline. This breakout represents a potential shift from a bearish or consolidating structure to a bullish one. The price has currently paused near the $90 resistance zone, which is a natural reactio
S&P 500: Global Uptrend Resumed. The V-Recovery Masterclass.🧠 The Great V-Reversal: From Capitulation to Lift-off ( CME_MINI:ES1! )
The market just sent a clear message. If you were watching the order flow on S&P 500 Futures ( CME_MINI:ES1! ) yesterday, you witnessed a masterclass in retail entrapment. Now, the tables have turned.
📉 Yesterday’s Liquidity

TOTAL Market Cap: Old Cycle Tops Are Becoming SupportCrypto TOTAL Market Cap is sitting at one of the most important cycle retest zones on the chart.
The key idea is simple:
Old cycle tops are trying to become new cycle support.
In the previous structure, the 2018 ATH area later became the 2022 cycle-bottom region.
That was a major market message.

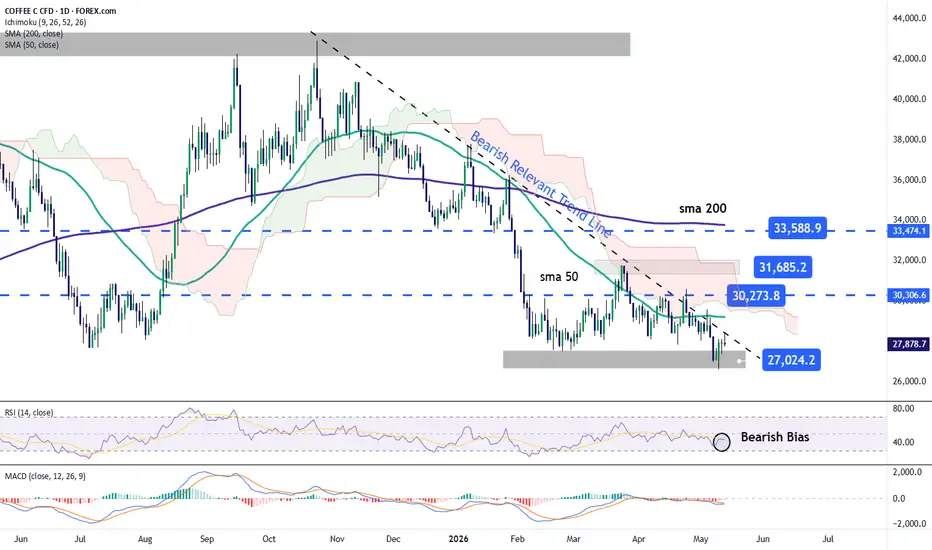
Coffee price continues to maintain a bearish biasSince the beginning of the month, coffee has maintained a consistent short-term bearish bias, accumulating a decline of more than 4.00% in its price.
The selling pressure, which has already extended over several weeks of trading, remains mainly driven by expectations of a larger coffee harvest in B
Bitcoin Weekly Update: Bear Market Rally or Real Reversal?#Bitcoin weekly update:
On the weekly timeframe, BTC is trading just below the 50 EMA resistance, a level that has acted as strong resistance during previous bear market phases.
Right now, many traders and your favourite influencer believe the bottom is already in and that BTC is ready for a strai

Copper Hit $6.71: Is This the Final Push or a New Beginning?Copper Hit $6.71: Is This the Final Push or a New Beginning?
AI electricity infrastructure, Grasberg supply risk, and a sulfuric acid crisis on top... All pricing in simultaneously.
So what's Copper's story on the long-term chart?
Copper is currently trading at $6.64 and above its 52-week movi

Gold May See a Short-Term Pullback Before Continuing Higher📊 Market Overview:
Global gold prices (XAU/USD) are currently fluctuating around the 4,700 USD/oz area after facing short-term profit-taking pressure. The main reason comes from the recovery of the US Dollar and rising US Treasury yields following higher-than-expected US inflation data. However, sa

See all editors' picks ideas
Fractional EMA Kalman Filter [D7]Fractional EMA Kalman Filter
1. Description
Fractional EMA Kalman Filter is an experimental smoothing and state-estimation tool that combines a Kalman filter framework with a fractional EMA input. The objective is to create a filter that remains subdued during ranging conditions while retaini
Pine Script® indicator

Neural Weight Oscillator (Zeiierman)█ Overview
The Neural Weight Oscillator (Zeiierman) is an adaptive multi-factor oscillator that combines structured decision-making with dynamic market learning.
The script analyzes three core market behaviors: Trend, Mean Reversion, and Momentum. Instead of treating these components equally, t
Pine Script® indicator

NeuraLib: A Native AI and Deep Learning RuntimeNeuraLib is a tensor-based, auto-differentiating Machine Learning runtime built natively for Pine Script™.
It brings real Deep Learning mechanisms that power modern Artificial Intelligence systems into TradingView. Instead of relying on fixed formulas, static regressions, or rigid structures, Neur
Pine Script® library

Pine3D: A Native 3D Graphical Rendering EnginePine3D is a full 3D rendering engine for TradingView, powered by Pine Script™ v6.
Pine3D pushes forward the frontier of TradingView 3D rendering capabilities, providing a fully fledged graphical engine under an intuitive, chainable, object oriented API. Build meshes, transform them in world space,
Pine Script® library

TASC 2026.05 The AutoTune Filter█ OVERVIEW
This script implements the AutoTune Filter described by John F. Ehlers in the article "A Rolling Autocorrelation Function" from the May 2026 edition of the TASC Traders' Tips . The script analyzes rolling autocorrelation in filtered price data to calculate a band-pass filter that dyn
Pine Script® indicator

Smart Trader, Episode 06, Isotropic Trend Lines🔷 WHAT IS ST-EP06 — ISOTROPIC TREND LINES?
ST-EP06 is a multi-scale structural trend channel indicator built on a σ-normalized coordinate system. It is designed to solve one of the oldest unaddressed problems in technical analysis:
trend angles that cannot be compared across instruments, timef
Pine Script® indicator

AI Predictive Flow (Zeiierman)█ Overview
AI Predictive Flow (Zeiierman) is a pattern-based oscillator that estimates future price direction by comparing the current market state to similar historical conditions.
Instead of relying on traditional indicators like momentum or moving averages alone, the script builds a multi-fe
Pine Script® indicator

Focus Bars [Kioseff Trading]Hello Traders!
🔹 Focus Bars
Focus Bars is a lower-timeframe reconstruction tool designed to break each candle into a price-based internal structure .
Instead of viewing a bar as a single OHLC print, this tool redistributes intrabar participation across price levels, showing where activity, del
Pine Script® indicator

Carrier Volatility [Pumori]Carrier Volatility
This is the foundational Pulse component of the ET Massif Framework research suite.
Description
Pumori is a high-resolution volatility and impulse response tool built around an ultra-short fractional length (0.1 EMA). It is a high-frequency carrier framework that exposes the
Pine Script® indicator

Multi Timeframe Volume Profiles [TradingIQ]Hello Traders!
🔹 Multi-Timeframe Volume Profiles
Multi-Timeframe Volume Profiles is a visualization tool designed to show how volume and participation develop across multiple timeframes - all in one view.
Instead of switching between charts and trying to mentally piece together context, this to
Pine Script® indicator

See all indicators and strategies
Community trends
Nebius Stock Soars on Huge Demand, 7X Revenue Rise. Who Knew?Jensen Huang knew. That’s who. And he told you.
A few months ago many traders didn’t know what Nebius NASDAQ:NBIS was. Others looked at the stock and most likely thought: “Interesting, I'll wait for the drop.”
Fast forward to now, and the stock has turned into one of the market’s hottest AI in
Tesla - Heading for new all time highs!🤖Tesla ( NASDAQ:TSLA ) is about to break out:
🔎Analysis summary:
Back in 2011 and back in 2020, Tesla created significant all time high breakouts. And looking at the past couple of years, Tesla once again established a strong rising channel formation. The bullish breakout is now very likely a

NBIS: Ascending Channel and Bull Flag Breakout, Targets Ahead!Hello There,
welcome to my new analysis about NBIS from the weekly timeframe perspective. As I monitored the stock market recently, I spotted interesting stocks, forming substantial setups to convert into strong surplus trading opportunities. One of them being NBIS, the stock recently increased bu


Today we got in BABA longWe acted on what we said we were going to do on our last video and I'm here to let you all know were in BABA with 1% of portfolio as it has retraced 50% of the bullish engulfing candle.

ONDS (1D) — Compression broken on record Q1 and guidance raised NASDAQ:ONDS
Ondas Inc. trades May 14 mid-session at $10.89 with the day running +22.91% on accumulated volume of 119.4M, after opening at $9.99 and marking intraday high at $10.97 following a tag of $9.60 on the open. The action cleanly breaks the lateral compression the quote had built between $8

RDW 1W Structural Compression After ExpansionOn the weekly chart Redwire has completed a full market cycle from base formation to impulsive expansion and into deep correction. The long-term bottom formed in the 2–3 range, where accumulation developed before the breakout phase. That base led to an expansion move toward 26.66, marked by volatili

Mastercard (MA) - Smart Money Entry ZoneEntry Zone: $465 - $478 (Major institutional liquidity pool & high volume support).
The Fundamental Setup: Duopoly power ensures automatic revenue growth under global inflationary pressure without credit risk exposure.
Whale Action: Large funds are generating fake retail panic to load heavily at

Trading Plan: WMT (4H) – ShortTrading Plan: WMT (4H) – Short
• Asset: WMT
• Timeframe: 4-Hour
• Direction: Short
• Entry: Around 131.65
• Stop Loss: 134.00 – 135.00
• TP1: 126.70 → Reduce 50% position; move SL to break-even
• TP2: 122.50 → Reduce half of remaining position; tighten stop loss
• TP3: 115.00 → Reduce half of rema


See all stocks ideas
Today
MNOVMediciNova, Inc.
Actual
−0.05
USD
Estimate
−0.08
USD
Today
AZA2Z Cust2Mate Solutions Corp.
Actual
−0.19
USD
Estimate
−0.15
USD
Today
NYCAmerican Strategic Investment Co.
Actual
−3.04
USD
Estimate
—
Today
SPRYARS Pharmaceuticals, Inc.
Actual
−0.61
USD
Estimate
−0.52
USD
Today
MHHMastech Digital, Inc
Actual
0.11
USD
Estimate
0.10
USD
Today
CREXCreative Realities, Inc.
Actual
−0.71
USD
Estimate
−0.47
USD
Today
LMFALM Funding America, Inc.
Actual
−0.47
USD
Estimate
−0.22
USD
Today
INKTMiNK Therapeutics, Inc.
Actual
−0.57
USD
Estimate
−0.77
USD
See more events
Community trends
Bitcoin short-term, the retrace is overThis might be a little early for most people, yet I am getting some signals saying that the Bitcoin retrace is already over. EMA144 is being tested as support.
When Bitcoin turns bullish, there aren't that many red days. It either moves forward or goes sideways. Here we can see some sideways at res

BTCUSD Short-Term AnalysisBTCUSD facing major resistance at 82,103. Expect potential pullback towards 79,019 – 76,270 levels. Watch key support and resistance zones for trend confirmation or reversal opportunities

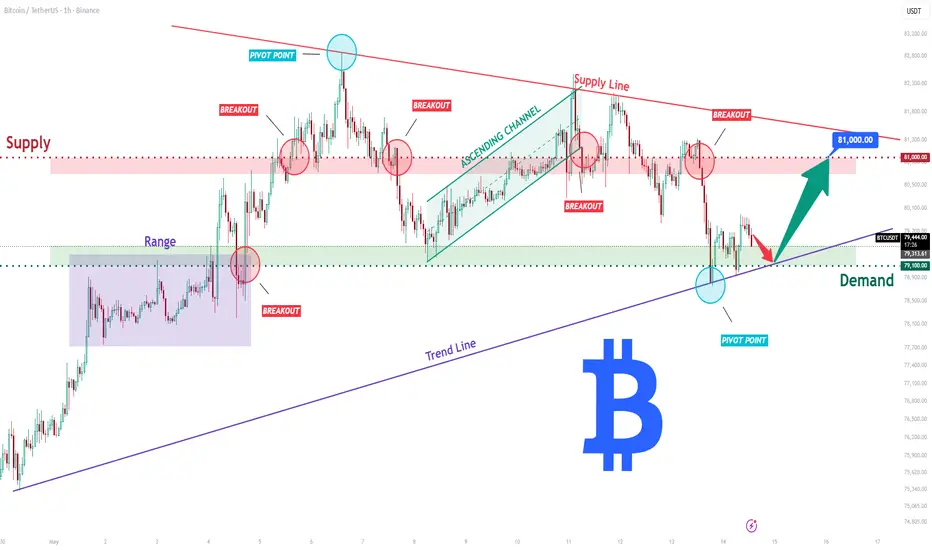
BTCUSDT Long: Rebound From Demand Could Lead to 81,000Hello traders! Here’s my technical outlook based on the current BTCUSDT (1H) chart structure. Bitcoin previously traded inside a range before breaking higher and forming an ascending channel. After reaching a major pivot point near the upper trendline, price reversed and began a corrective move.
Cu
This Formation Leads to a Massive BTCUSD Dump!Hello There,
welcome to my new analysis about BTCUSD from the weekly timeframe perspective. BTCUSD is testing the remaining levels where there is still a lot of bearish whale volume awaiting to be dumped. As I mentioned in my previous idea, BTCUSD is being prepared for a major bearish dump towards

BTC (New action soon)BTC / USD
Price is consolidating below resistance and seems like its ready for new move soon!
What next ?
Area around 82k - 84k is considered a strong resistance..action here will determine the next short term move in market and in bitcoin
Scenario 1 🔥 (green arrow) :
small dump then buyers c

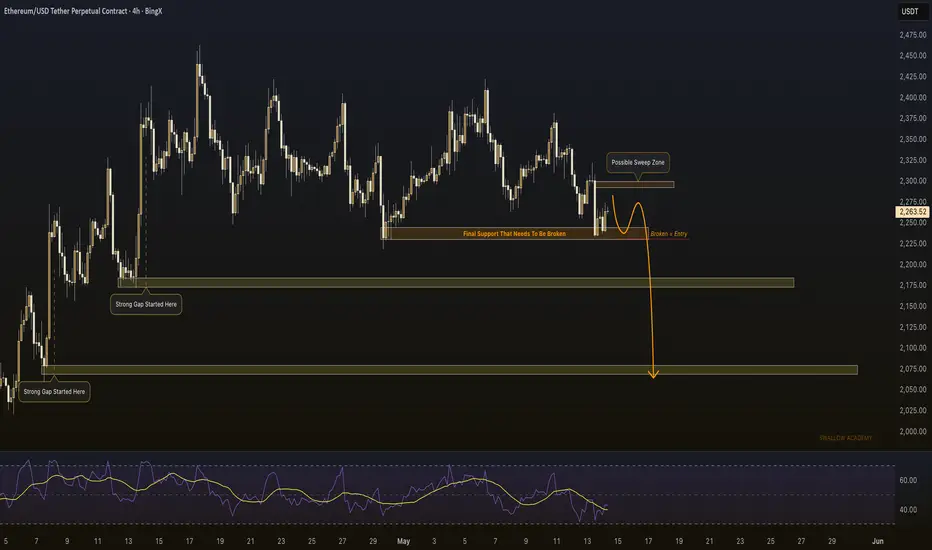
ETHUSD – Bearish Pressure Building Below 2300, Eyes on 2075ETH is printing lower highs on the smaller timeframes and sellers are firmly in control — a clean short setup is forming right now.
Why This Level Matters:
The 2240 zone is the final support standing between current price and a significant drop. Two strong gap zones sit below at 2175 and 2075, an
Bitcoin Turns Back Up _ But the Real Test Is AheadAs I expected in the previous idea , Bitcoin ( BINANCE:BTCUSDT ) started dropping and hit all its targets—full target down. But now the question is this: in recent hours, Bitcoin has started rising again with solid momentum. One of the reasons for this increase—just like previous weeks—is Bitcoin

BTC/USDT: THE HANDOVER FLUSHThe Logic:
Double Pattern Failure: The internal Rising Wedge has decisively snapped, and the subsequent retest of the breakdown zone confirmed heavy institutional selling.
Broadening Chaos: Price is vibrating inside a massive Megaphone Formation. These patterns signify extreme indecision; since we

BTC/USD – Key Support, Resistance & Target LevelsBitcoin (BTC/USD) is currently showing short-term consolidation after a pullback from recent highs. Price is trading near a support zone around 78,800 – 79,000, with resistance levels forming near 80,600 – 81,037 as indicated by Fibonacci retracement levels (0.5 – 0.618). This setup highlights a pot

Sellers Regaining Control on Bitcoin Chart🚨 BTC/USD is showing signs of weakness after failing to maintain momentum above the highlighted resistance zone near the upper trend channel. 📉 The chart reflects a possible bearish breakout structure as repeated rejection candles indicate that buyers are losing control in the short term. After a st

See all crypto ideas
Gold 30Min Engaged ( Bearish Reversal Detected )HANZO MARKET LIQUIDITY REPORT
Gold
Timeframe: 30min (Volume Basis)
Scale: Higher Timeframe Context / Deep Volume analysis
━━━━━━━━━━━━━━━━━━━━━━
Market Observation
This analysis is focusing on structural behavior, liquidity zones, Volume analysis
and key areas of interest within the current range.

Gold (XAUUSD) Key Levels & Trend AnalysisGold is trading near 4,762, facing minor resistance. Key levels to watch: support at 4,651 and 4,593, resistance at 4,720 and 4,882. Trend line indicates potential bearish continuation if 4,762 fails to break, otherwise bullish above this level. Use these levels to plan trades and monitor price reac

XAUUSDHello Traders! 👋
What are your thoughts on Gold?
Gold continues to trade within a well-defined descending channel, with price reacting once again to the upper trendline resistance.
The highlighted supply zone around 4,750–4,850 remains a key resistance area for buyers. This zone also coincides wit

GOLD: THE $4,780 TRIANGLE SQUEEZEThe Logic:
Continuation Pattern: The Triangle pattern is coiling tight after the impulsive recovery leg from May 6.
Compression: Volatility is hitting a local floor at $4,690. In 2026 geometry, this usually precedes an explosive +2% expansion.
Primary Target: The macro Resistance line near $4,780

GOLD MARKET ANALYSIS - 4730 HOLDING AND AWAITING BREAKOUTHey Everyone,
Please reveuw our 4H chart video update.
On the 4H chart, the bullish gap at 4730 has now been filled. However, the bigger retracement gap below remains unfilled, as our 1H level continues to provide strong support.
We’ll keep you updated with further market developments.
Mr Gold

XAUUSD: Triangle Breakout Could Trigger Rally to 4,800$Hello everyone, here is my breakdown of the current XAUUSD setup.
Market Analysis
Gold previously traded inside an upward channel, confirming strong bullish momentum. After breaking above the channel, price entered a consolidation phase and formed a large triangle pattern, where the ascending sup

Silver – Is the Rally Finally Running Out of Steam?If you’ve been following my recent analyses, you already know that I’ve been bullish on Silver since Monday and repeatedly argued that, technically speaking, Silver looked much stronger and much cleaner than Gold.
And so far, that view played out very well.
After the expected breakout above the 81

XAUUSD – Bearish Rejection Structure📊 XAUUSD – Bearish Rejection Structure
🔍 Market Overview
Gold is currently facing strong rejection from the upper resistance zone after failing to sustain bullish momentum. Price action remains capped below the marked resistance area, while the recent trendline break suggests sellers are regaining

GOLD - Consolidation before a strong moveICMARKETS:XAUUSD is in a bullish consolidation phase, trading within the 4,650–4,750 range. The market is awaiting the outcome of the meeting between Trump and Xi Jinping, as well as the release of the latest economic data.
The lack of progress in U.S.-Iran negotiations and rising inflation ex

SILVER (XAG/USD): Targets $90; Will the Rise Continue?I see a confirmed violation of an intraday horizontal resistance
on 📈SILVER
This suggests a strong likelihood of continued bullish momentum.
Expect a price rise to 90.00

See all futures ideas
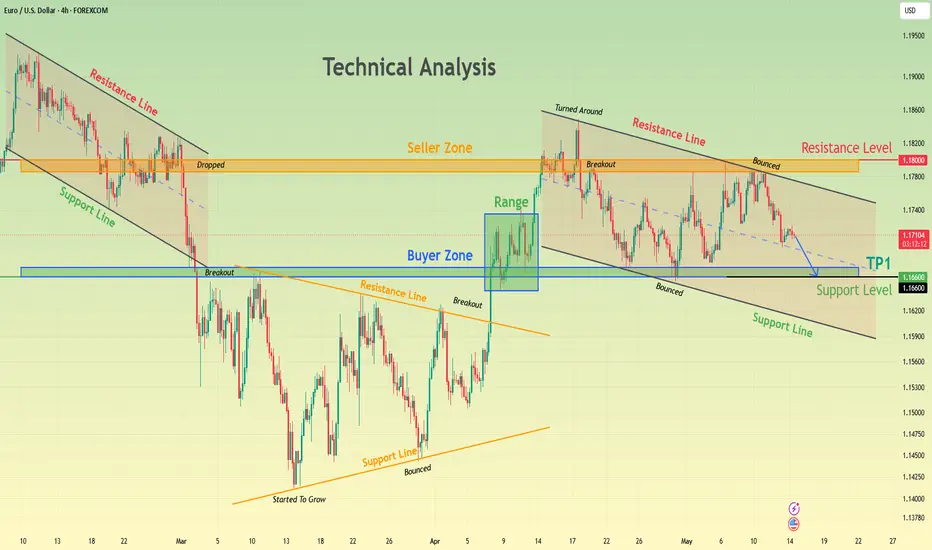
EURUSD Analysis: Resistance Holds, Support at 1.1660 in FocusHello traders! Here is my technical outlook based on the current EURUSD (4H) chart structure. EURUSD previously traded inside a descending channel. After forming a local bottom, price reversed sharply, broke above the descending resistance line, and entered a consolidation range. Currently, EURUSD i
BUY GBP/JPY - Triangle Breakout (14.05.2026)GBP/JPY is showing a bullish triangle breakout after price pushed above the descending trendline and held above the highlighted support zone. The breakout suggests buyers are attempting to regain short-term control, with momentum pointing toward the marked resistance levels. As long as price stays a

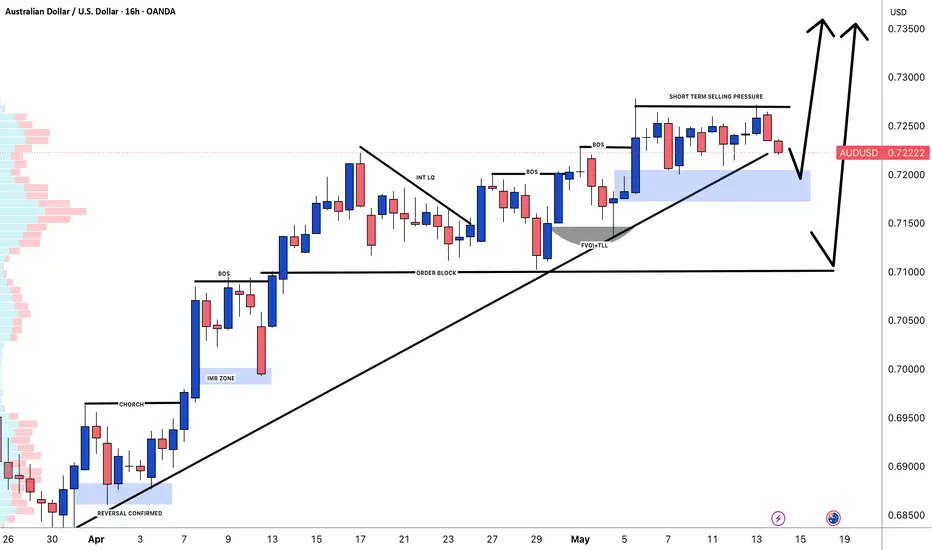
AUDUSD: Two Areas For Buyers, Targeting 0.7700Dear Traders,
We hope you’re all doing well. We have two excellent buying opportunities in the AUDUSD pair. These areas have the most potential given DXY’s recent extreme bullish behaviour. Looking at recent data on AUDUSD, the price is unlikely to turn bearish as USD’s bullish nature may not las
EURUSD Short: Could Drop Toward 1.1650 Demand ZoneHello traders! Here’s my technical outlook based on the current EURUSD (2H) chart structure. EURUSD previously traded inside an ascending channel. After reaching a pivot point and rejection from this area, price reversed and entered a descending channel.
Currently, EURUSD is trading below the 1.175

AUD/JPY Ready To Go Down , Best 2 Places For Sell Cleared ! Here is my AUD/JPY 4H Charts And here is my opinion , we have a very strong res area @ 114.700 , this is the best area we can sell this pair from it cuz if we check we will see that this area forced the price to go down when it touch it last time for more than 300 pips so that prove it`s a very stro

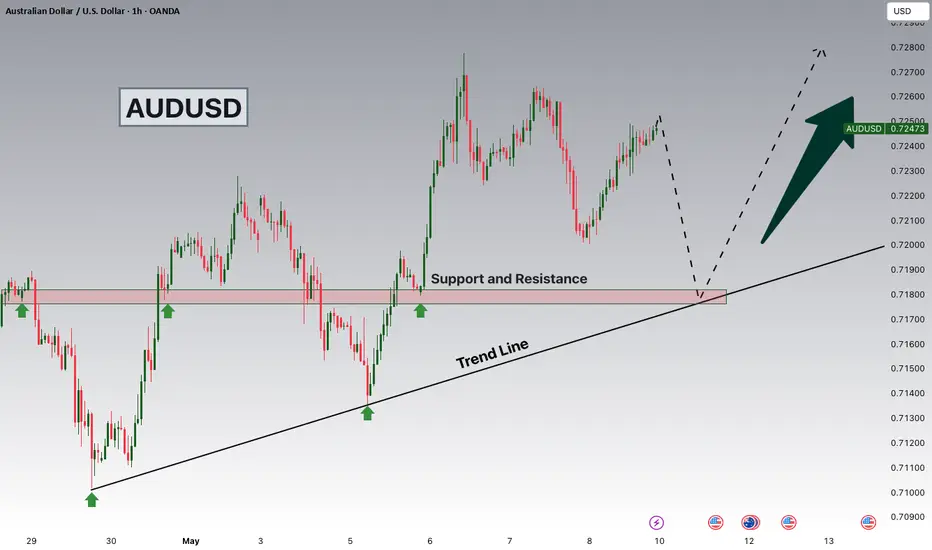
AUDUSD is Nearing a Strong Support!Hey Traders, in today's trading session we are monitoring AUDUSD for a buying opportunity around 0.71900 zone, AUDUSD is trading in an uptrend and currently is in a correction phase in which it is approaching the trend at 0.71900 support and resistance area.
Trade safe, Joe.
USDJPY Bearish Pullback Begins – Targets Locked BelowUSDJPY is showing signs of weakness after rejecting the upper resistance zone near 158.00. Price action inside the rising channel looks exhausted, and sellers are stepping in as momentum slows down.
A breakdown below the current support could trigger a bearish move toward the first target around 157

EURUSD Bearish Trendline breakdown Target 1.1460Key Levels
Resistance Zone
1.1710 – 1.1780
Strong supply area with repeated rejection candles.
Current Support
1.1640 – 1.1630
Price is attempting a temporary bounce here.
Major Bearish Target
1.1460 – 1.1480
This is the projected downside target from the breakdown structure.
Expected Scenario
Price

AUDUSD Rejected at Resistance | Pullback Scenario in FocusAUDUSD Rejected at Resistance | Pullback Scenario in Focus
AUDUSD has the potential to start a range trading pattern.
The price faced strong resistance near the upper boundary near 0.7270. AUD had some strange strength yesterday but today looks more stable.
The price could drop to 0.7235 as the

USD/CHF: THE "FALSE BREAK" TRAPThe Logic:
Megaphone Rejection: Price rejected the upper boundary of the macro broadening wedge.
False Break: A local triangle "breakout" failed instantly, trapping aggressive buyers at 0.7880.
Target: Gravity is pulling the pair toward the 0.7680 floor at the bottom of the megaphone.
The Trap:

See all forex ideas
Trade directly on Supercharts through our supported, fully-verified, and user-reviewed brokers.