SpaceX IPO to Mint First-Ever Trillionaire. And More Wild Stuff.Wall Street loves a big number. Elon Musk loves an even bigger one. And today, SpaceX's NASDAQ:SPCX upcoming IPO may deliver the biggest figure of them all. Mark your IPO calendar . It’s here.
( Oh, and excuse the blank screen above. That'll change once the shares drop for trading. )
With the

The best trades require research, then commitment.
Get started for free$0 forever, no credit card needed
See our space storyWith astronaut Scott "Kidd" Poteet
Space mission
Where the world does markets
Join 100 million traders and investors taking the future into their own hands.

Gold Sheds 30% from Peak, Bitcoin Wipes Out 50%. Why So Serious?At first glance, these two should move opposite to one another. Inverse correlation. Unless, interest rates are involved.
Here’s how and why prospects of higher borrowing costs hurt both gold OANDA:XAUUSD and Bitcoin BITSTAMP:BTCUSD at the same time. The safe haven and the risk asset walk into

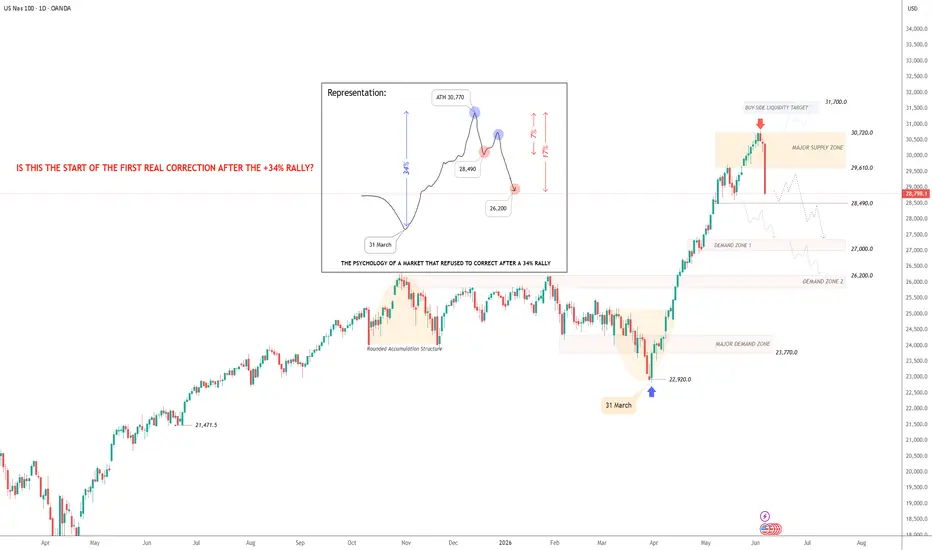
USNAS100 | PSYCHOLOGY BEHIND A 34% RALLY WITHOUT CORRECTIONUSNAS100 | THE PSYCHOLOGY OF A MARKET THAT REFUSED TO CORRECT FOR 34%
1. Introduction
Since the March 31st low near 22,920, the Nasdaq has experienced an extraordinary rally, climbing approximately 34% and reaching a new all-time high around 30,770.
What's fascinating about this move is not t
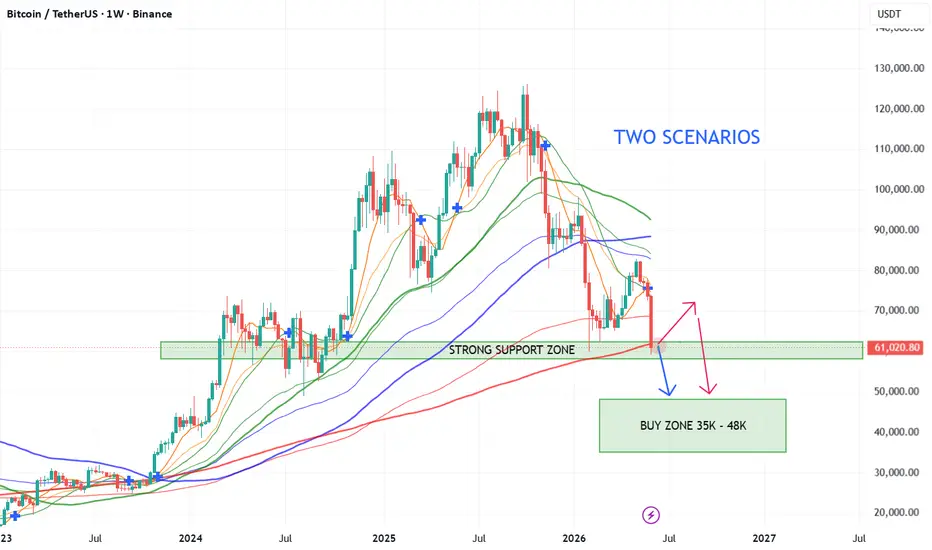
Bitcoin Is Testing the Floor — Not Starting a New Bull RunEveryone is waiting for the next Bitcoin bounce, but when I look at the weekly chart, I see something very different. BTC is currently sitting on a major support zone around 58k–62k USD, and this area is now under serious pressure. In the past, this zone acted as an important reaction area, but the
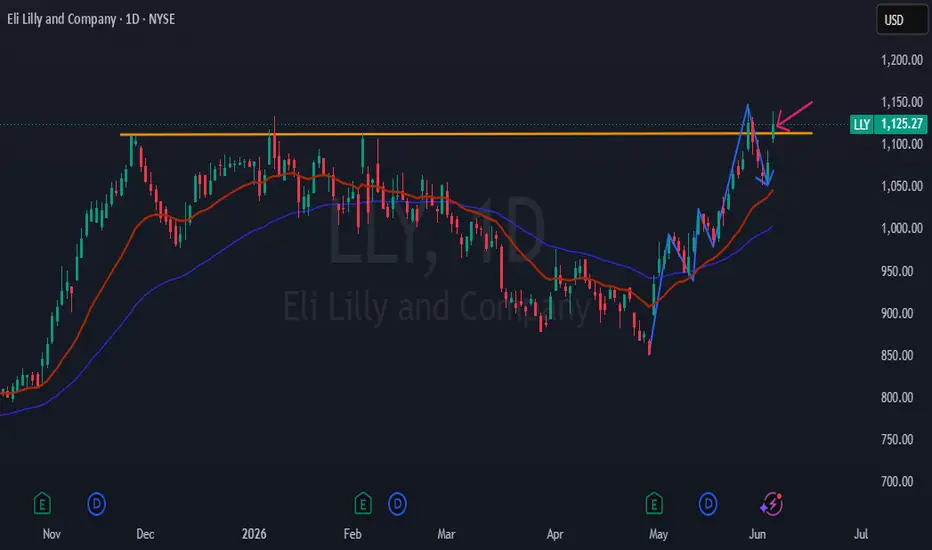
Eli Lilly Breaks Above Key Resistance as Uptrend StrengthensLLY is attracting renewed buying interest following a healthy pullback, with the stock successfully reclaiming and closing above the key $1,114 resistance level for the second time. The shares remain in a strong uptrend, characterized by higher highs and higher lows, while continuing to trade above
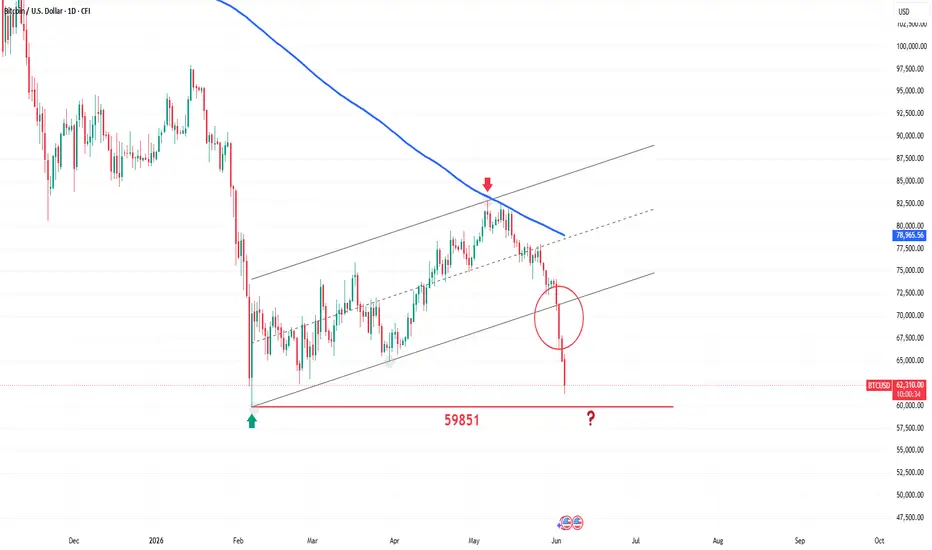
Growing Pressure on Bitcoin!Bitcoin came under significant selling pressure this week, falling to its lowest level in nearly four months before rebounding above the $64,000 mark. The decline was largely driven by escalating geopolitical tensions in the Middle East, which negatively affected investor appetite for risk-sensitive
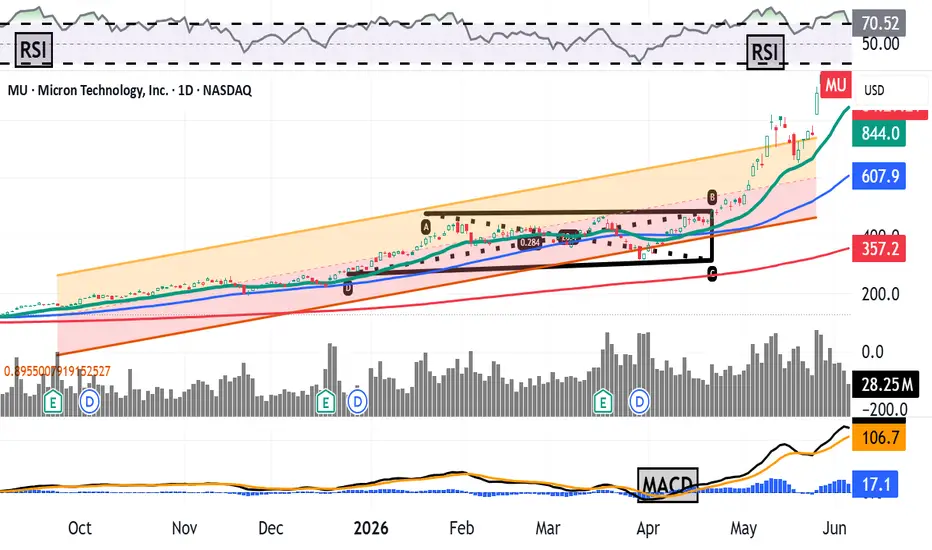
Micron Hit an All-Time High, Then Fell. What Does Its Chart Say?Micron Technology NASDAQ:MU fell some 6% Thursday morning after rising nearly 1,000% over 12 months, taking the stock to an all-time intraday high earlier this week. Let's check out what its chart and fundamentals say could happen next.
Micron's Fundamental Analysis
MU sank Thursday is sympath
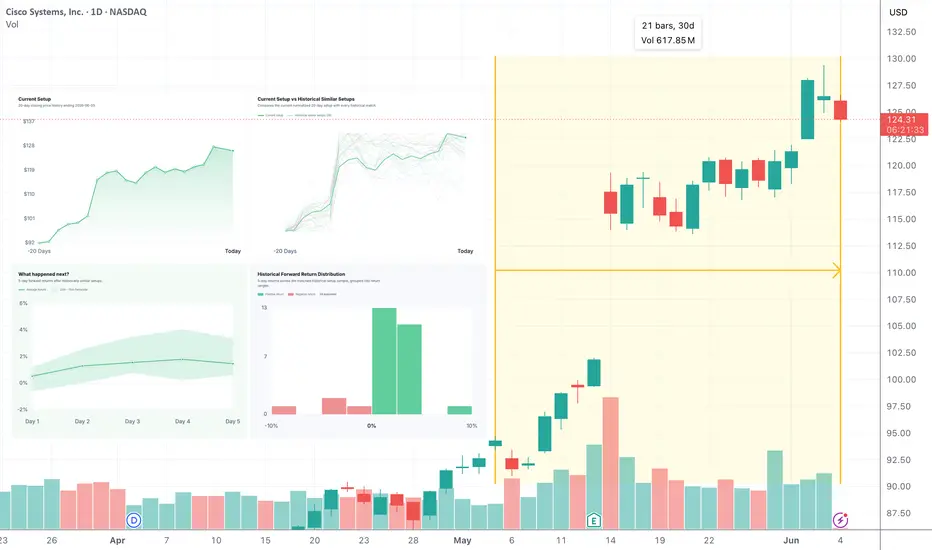
CSCO: Moderately bullish skew with elevated downside riskI will share interesting trading patterns regularly and hopefully these patterns can give you some ideas.
Today I start from Cisco Systems (CSCO) which showed a moderately bullish historical setup after a strong 20-day move. I have already highlighted the setup in the chart. Similar setup has bee
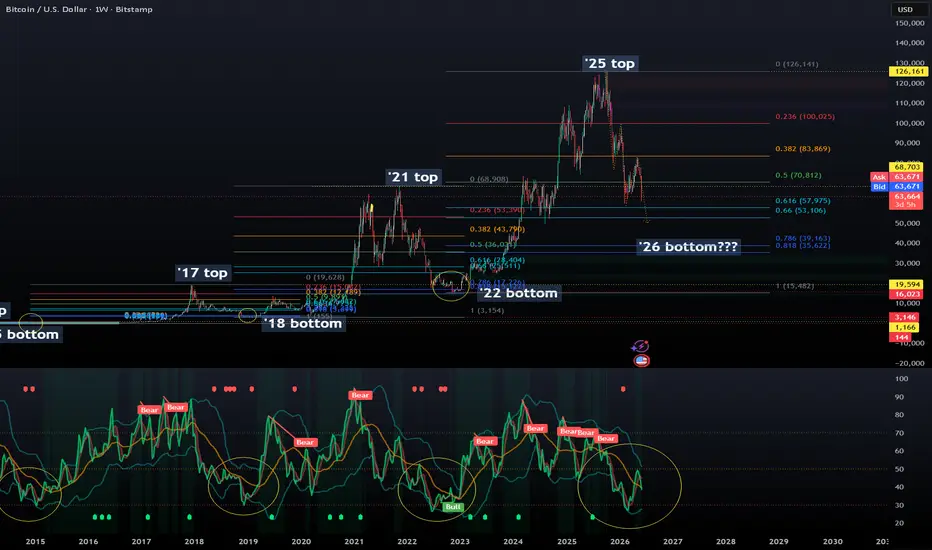
BTC Weekly Cycle – 0.786/0.818 Fib + TDI + Miner CapitulationLooking at BTC's full price history on the weekly chart, one pattern has repeated itself across every single major cycle without exception: the macro bottom formed inside the 0.786–0.818 Fibonacci retracement zone of that cycle's range, while the weekly TDI was fully washed out near the 30 level, an
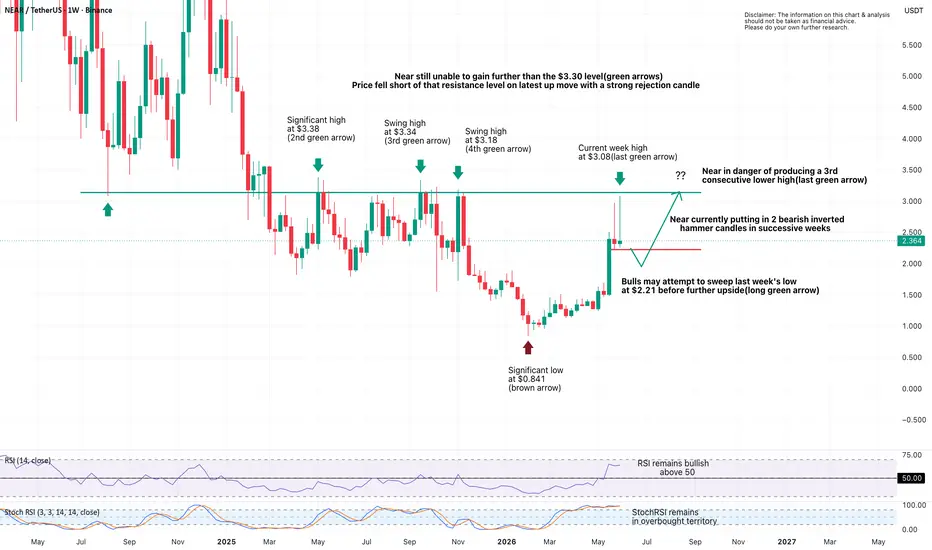
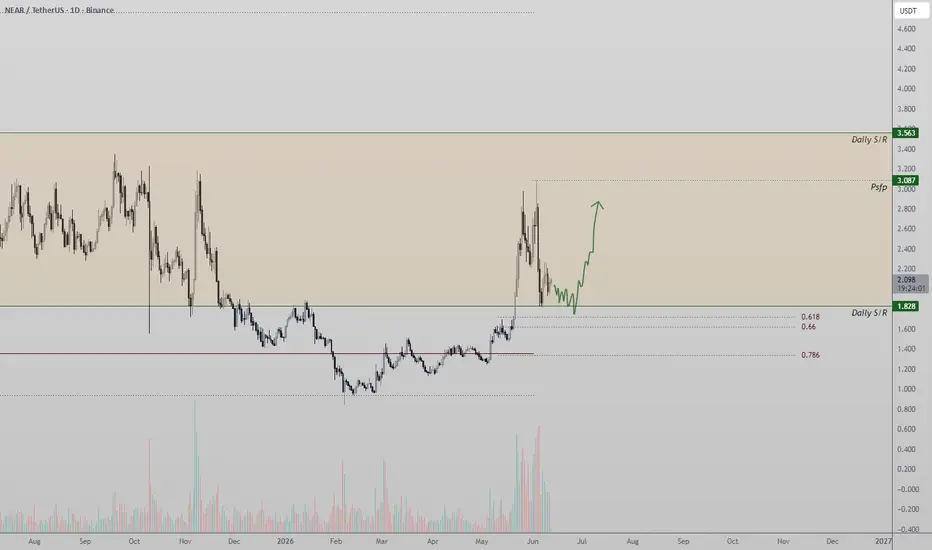
NEAR Rejected Before Major ResistanceLower Highs Continue To Build
• NEAR has once again failed to reach the key $3.30 resistance zone.
• The latest rally stalled at $3.08, leaving a potential third consecutive lower high on the weekly chart.
Rejection Candles Raise Concerns
• Two successive inverted hammer-style candles suggest bu
See all editors' picks ideas
ExprLibExprLib is a library for parsing and evaluating string expressions. It allows scripts to expose configurable logic by letting users define custom conditions and calculations based on available data.
█ KEY FEATURES
• Rich expression support:
• Built-in constants (e.g., `10`, `2.5`, `5e-2`,
Pine Script® library

Chart Patterns Screener [Trendoscope]🎲 Overview
Chart Patterns Screener is an advanced Pine Script designed to automatically detect and display classical chart patterns on TradingView. It is a specialized, fine-tuned version of the popular Auto Chart Patterns indicator, optimized specifically for use with the Pine Screener.
🎲 H
Pine Script® indicator

Machine Learning RSI | AI Classification & Ranking (Zeiierman)█ Overview
The Machine Learning RSI | AI Classification & Ranking (Zeiierman) is an adaptive RSI intelligence system that combines momentum analysis, historical analog recognition, machine learning classification, confidence scoring, and dynamic trend management into a single framework.
Rather
Pine Script® indicator

Polynomial/Linear Regression Volume Profile [BigBeluga]Polynomial/Linear Regression Volume Profile is a state-of-the-art charting framework that blends advanced statistical modeling with localized volume distribution analysis. By evolving past traditional, static horizontal volume profiles, this indicator dynamically curves the volume profile matrix a
Pine Script® indicator

Whale Liquidity and Absorption Profile [AlgoAlpha]🟠 OVERVIEW
The Whale Liquidity and Absorption Profile maps intrabar buying, selling, delta, and absorption activity into stacked horizontal profiles. It samples lower timeframe volume data inside each chart candle, then groups that activity into price bins to show where aggressive participation and
Pine Script® indicator

Fractional EMA Kalman Filter [D7]Fractional EMA Kalman Filter
1. Description
Fractional EMA Kalman Filter is an experimental smoothing and state-estimation tool that combines a Kalman filter framework with a fractional EMA input. The objective is to create a filter that remains subdued during ranging conditions while retaini
Pine Script® indicator

Neural Weight Oscillator (Zeiierman)█ Overview
The Neural Weight Oscillator (Zeiierman) is an adaptive multi-factor oscillator that combines structured decision-making with dynamic market learning.
The script analyzes three core market behaviors: Trend, Mean Reversion, and Momentum. Instead of treating these components equally, t
Pine Script® indicator

NeuraLib: A Native AI and Deep Learning RuntimeNeuraLib is a tensor-based, auto-differentiating Machine Learning runtime built natively for Pine Script™.
It brings real Deep Learning mechanisms that power modern Artificial Intelligence systems into TradingView. Instead of relying on fixed formulas, static regressions, or rigid structures, Neur
Pine Script® library

Pine3D: A Native 3D Graphical Rendering EnginePine3D is a full 3D rendering engine for TradingView, powered by Pine Script™ v6.
Pine3D pushes forward the frontier of TradingView 3D rendering capabilities, providing a fully fledged graphical engine under an intuitive, chainable, object oriented API. Build meshes, transform them in world space,
Pine Script® library

TASC 2026.05 The AutoTune Filter█ OVERVIEW
This script implements the AutoTune Filter described by John F. Ehlers in the article "A Rolling Autocorrelation Function" from the May 2026 edition of the TASC Traders' Tips . The script analyzes rolling autocorrelation in filtered price data to calculate a band-pass filter that dyn
Pine Script® indicator

See all indicators and strategies
Community trends
SPCX / SpaceX: Wait for Structure, Not HypeSPCX is likely to attract strong retail attention, which means the first sessions may be highly volatile. For me, this is not a “buy at any price” setup, but a name to trade only after the market forms a clear structure.
Base case: I would wait for the first 30–90 minutes of trading to define the

SpaceX IPO to Mint First-Ever Trillionaire. And More Wild Stuff.Wall Street loves a big number. Elon Musk loves an even bigger one. And today, SpaceX's NASDAQ:SPCX upcoming IPO may deliver the biggest figure of them all. Mark your IPO calendar . It’s here.
( Oh, and excuse the blank screen above. That'll change once the shares drop for trading. )
With the
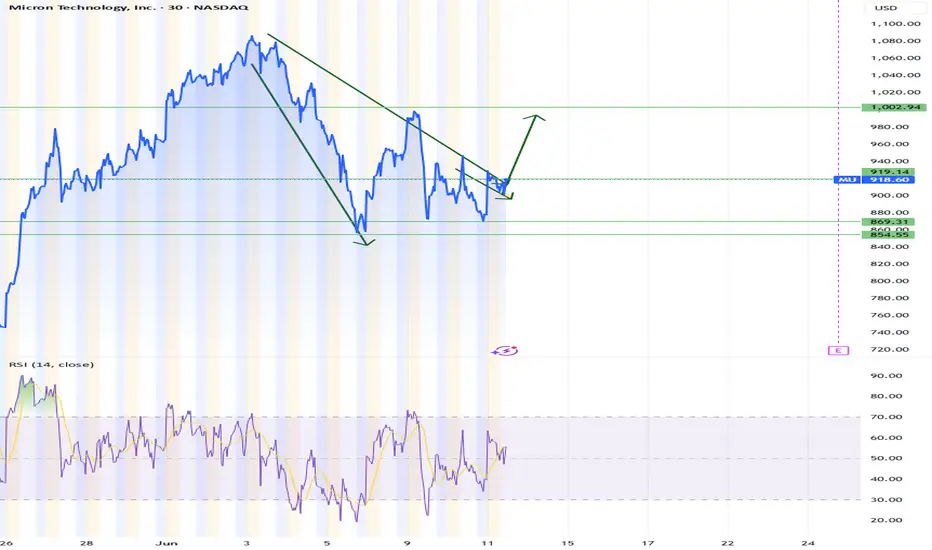
MU Micron , $900 Entry, $1350 Price Target0. Notes to follow
1. Correction from $1090
2. Double Bottom at $850
3. Wolfe out today with $1250 target
4. Looking at $240 from the high, and looking at $1240 Technical Target / Hence Wolfe target of $1250
5. Will probably push higher, looking at $1350 to take profits.
Cheers,
- DrChelsea
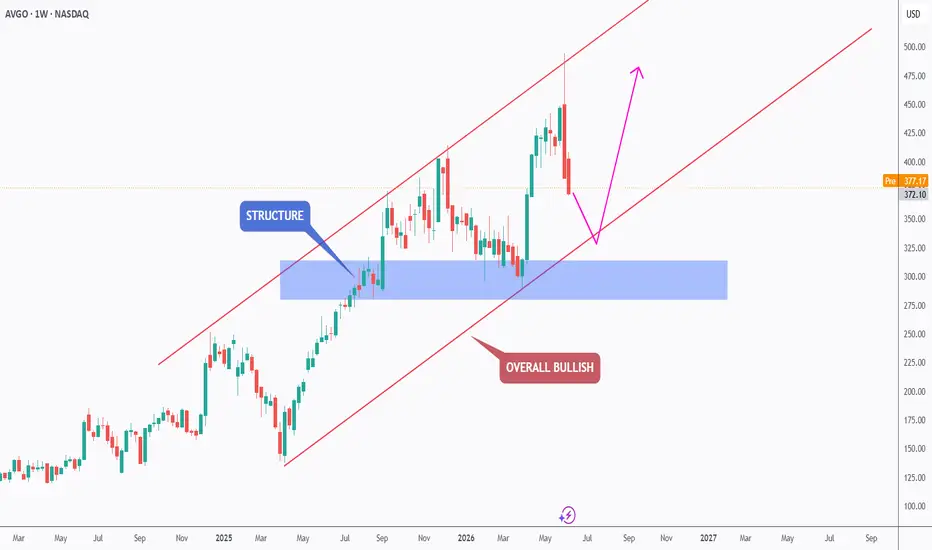
AVGO – Bullish Trend Meets Key Support AVGO has been maintaining a strong bullish structure, trading within a rising channel while consistently printing higher highs and higher lows.
After the recent correction, price is now approaching a major confluence support area formed by:
🔹 The lower bound of the rising channel
🔹 The blue suppor
APPLE 4-year Channel Up rejection eyes the 1W MA100 at $250.Apple Inc. (AAPL) got rejected last week at the top (Higher Highs trend-line) of its 4-year Channel Up and this week is correcting rather aggressively.
The 1W MACD is printing the same pattern that previous sequences (3) formed a market Top. That was seen on the December 23 2024, December 11 2023 a

TSLA Bullish Rebound from Trendline Support – Eyes on $417.23Tesla (TSLA) is showing a potential bullish recovery after finding support near the long-term ascending trendline around the **$380–$385** region. The recent bounce indicates that buyers are stepping back into the market following the sharp decline from the previous consolidation zone. If bullish mo

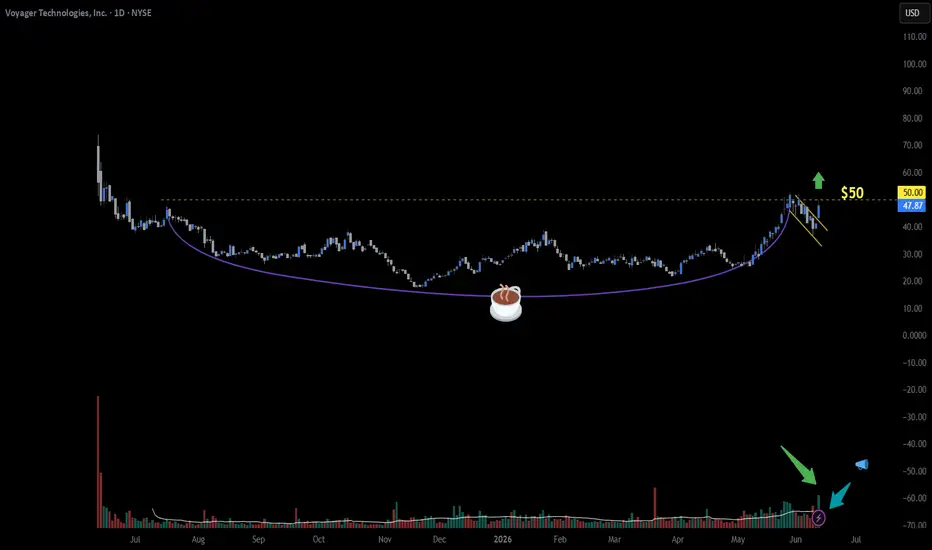
Take a voyage and enjoy cup of the space industry? Hot topic sector: Space
It is setting up before the SpaceX IPO - a boost for sympathetic or proxy trades.
Long period of consolidation with little chop.
Technical pattern: Cup-and-handle. And a quite nice handle that also appears as a bull flag.
Volume impulse off the handle over the 20 day MA.
Read
Lam Research seems to have toppedLam research had an extraordinary 5xing from April 2025 lows.
However, the run now seems to be complete. We have elliot wave completion, Demark signals and divergences flashing on multiple time frames. While the momentum is strong, I would expect it to stall at 350 mark and thereby reverse from her

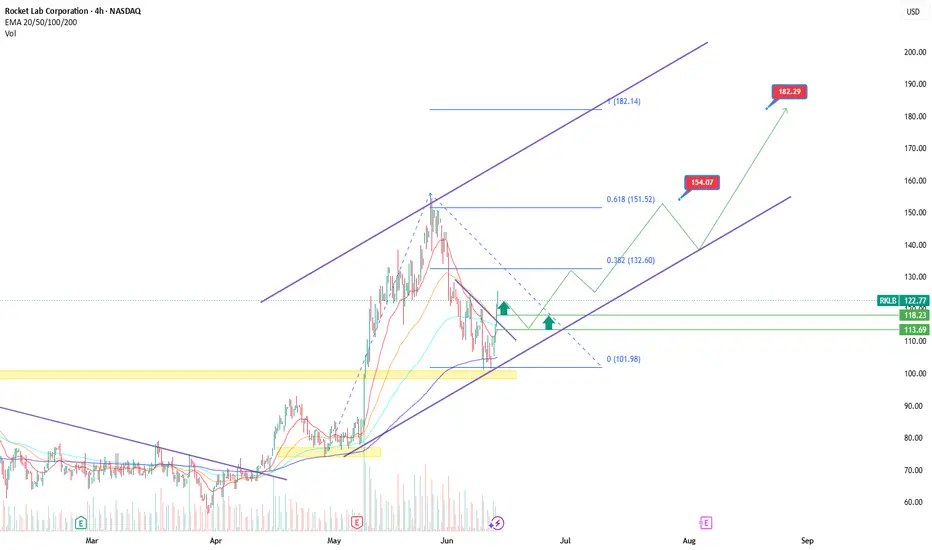
Rocket Lab: Is the correction nearing its end?After a powerful rally, Rocket Lab shares have entered a healthy correction phase, but the broader bullish structure remains intact. The company is one of the leading players in the space industry, providing launch services and developing advanced space systems. Trading on NASDAQ under the ticker RK
$NRGMetricValueSource2026 Adj EBITDA guide$5.325–5.825B, reaffirmed Stocktitanmid $5.58B2026 FCFbG guide$2.8–3.3B, reaffirmed Stocktitanmid $3.05B → $14.52/sh2026 Adj EPS guide$7.90–9.90 vs $8.78 consensus Benzingamid $8.90 → P/E ~14.6xLong-term framework≥14% adj EPS and FCF/share growth over five years

See all stocks ideas
Today
REPLReplimune Group, Inc.
Actual
—
Estimate
−0.71
USD
Today
CRMTAmerica's Car-Mart, Inc.
Actual
—
Estimate
−1.12
USD
Today
JVACoffee Holding Co., Inc.
Actual
—
Estimate
—
Today
ENGNenGene Therapeutics Inc.
Actual
—
Estimate
−0.47
USD
Today
PLCEChildren's Place, Inc. (The)
Actual
—
Estimate
−2.15
USD
Jun 15
CODACoda Octopus Group, Inc.
Actual
—
Estimate
0.13
USD
Jun 15
AIOTPowerFleet, Inc.
Actual
—
Estimate
−0.00
USD
Jun 15
JRSHJerash Holdings (US), Inc.
Actual
—
Estimate
−0.01
USD
See more events
Community trends
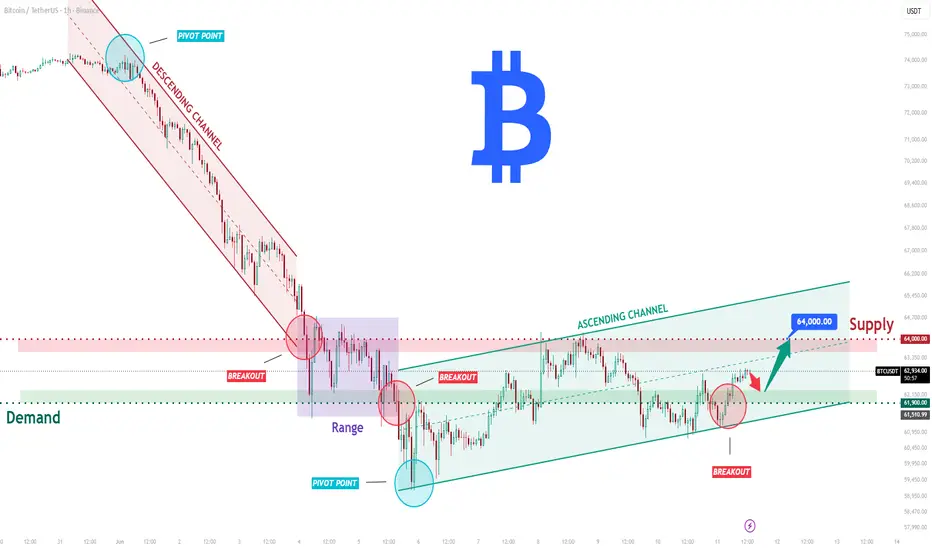
BTCUSDT Long: Bounce from Demand Open Path to the 64K Supply Hello traders! Here’s my technical outlook based on the current BTCUSDT (1H) chart structure. BTCUSDT previously traded inside a descending channel and reached a major pivot point near the lower boundary. After breaking above the channel resistance, price formed a new consolidation structure between
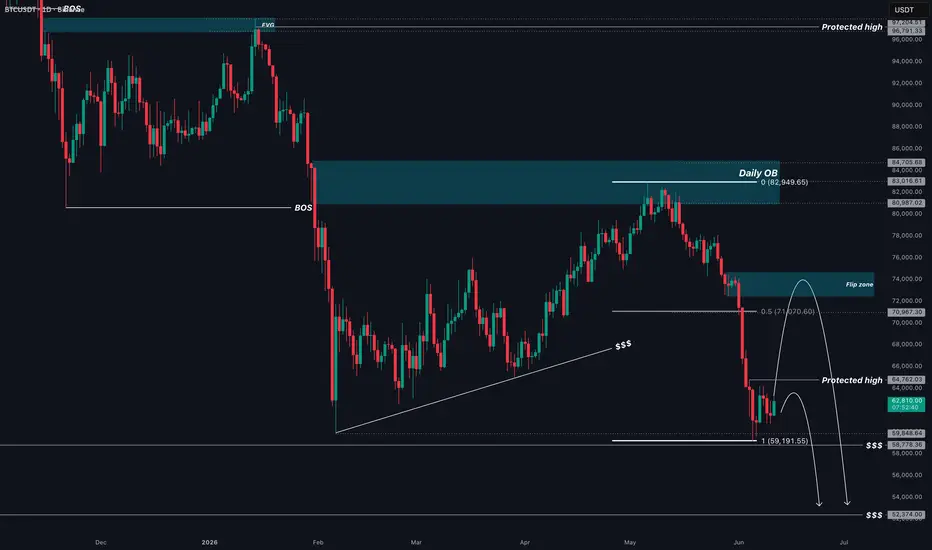
BTC | Bitcoin Stays Bearish Below the Protected High !📊 Daily Timeframe
On the Daily, #BTC (Bitcoin) was in a complete uptrend until it topped out at $126,255.99. From there, price printed an iCHoCH followed by an iBOS, and then confirmed a full bearish structural shift with an external CHoCH once it lost its protected low. Since then, the daily tr
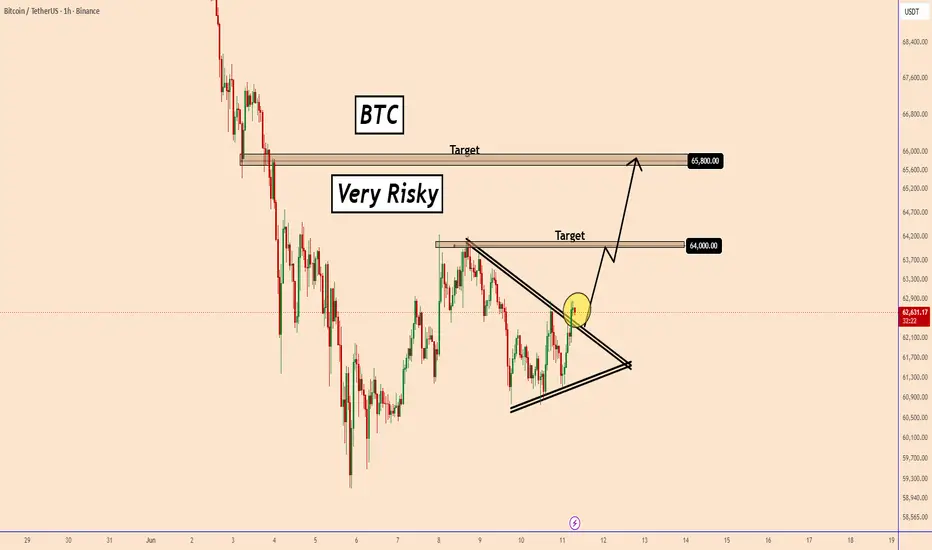
Bitcoin: Triangle Breakout Suggests More Upside AheadBitcoin: Triangle Breakout Suggests More Upside Ahead
After a long time, BTC is showing another clear position, at least for short-term trading.
The price has already broken out of a triangle pattern that indicates a possible upward move.
If the price does not develop further in this area, then
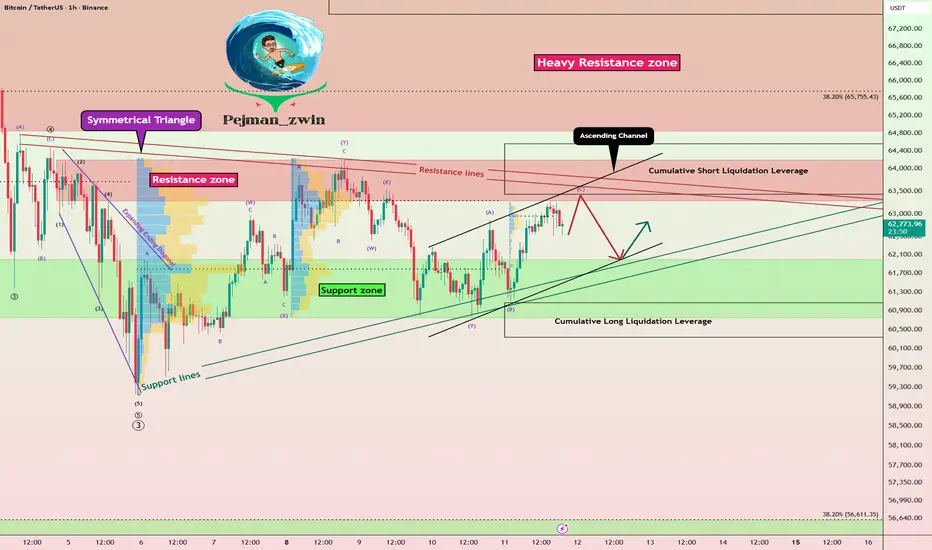
BTC Near Resistance Again_ This Triangle Could Decide the NextIn the past couple of days, Bitcoin ( BINANCE:BTCUSDT ) has been largely influenced by Middle Eastern news and U.S. indices, especially the S&P 500 ( FOREXCOM:SPX500 ). Recently, Bitcoin has begun an upward movement, and at the moment, it’s near the Cumulative Short Liquidation Leverage($64,560-$6
BTCUSDT: Support Holds — Retest of $64,400 Resistance BecomesHello everyone, here is my breakdown of the current BTCUSDT setup.
Market Analysis
BTCUSDT has been trading under a well-defined descending trendline after breaking down from a broad consolidation range near the recent highs. Several bearish breakouts below key structures confirmed strong selling

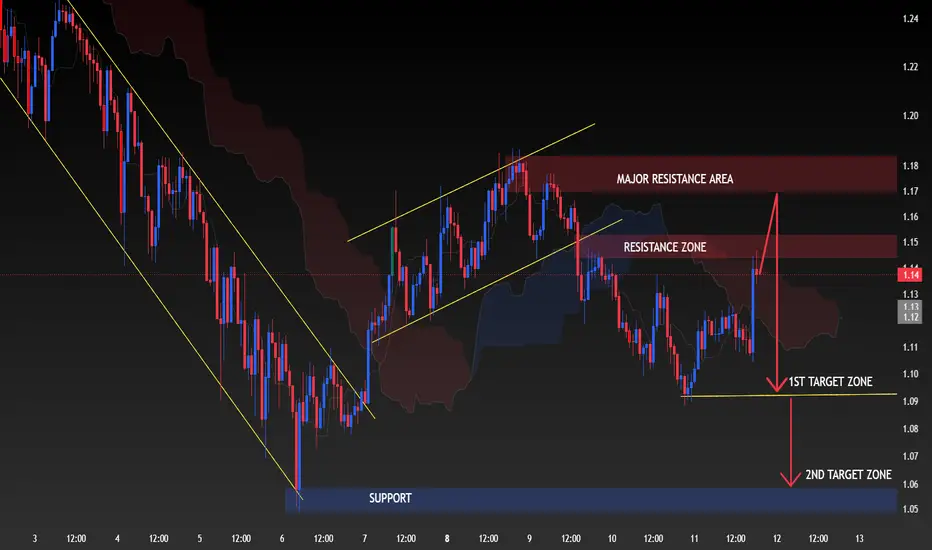
XRPUSDT — Chart BEARISH SETUP....📊 XRPUSDT — Target Plan (Educational Analysis)
Current structure shows price trading below the resistance zone (1.14–1.15) with weak momentum and possible bearish continuation.
🎯 Sell Targets:
• TP1: 1.090 ✅
• TP2: 1.060 🎯
• TP3: 1.050 🚀
🛑 Invalidation:
If price breaks and holds above 1.150–1.180
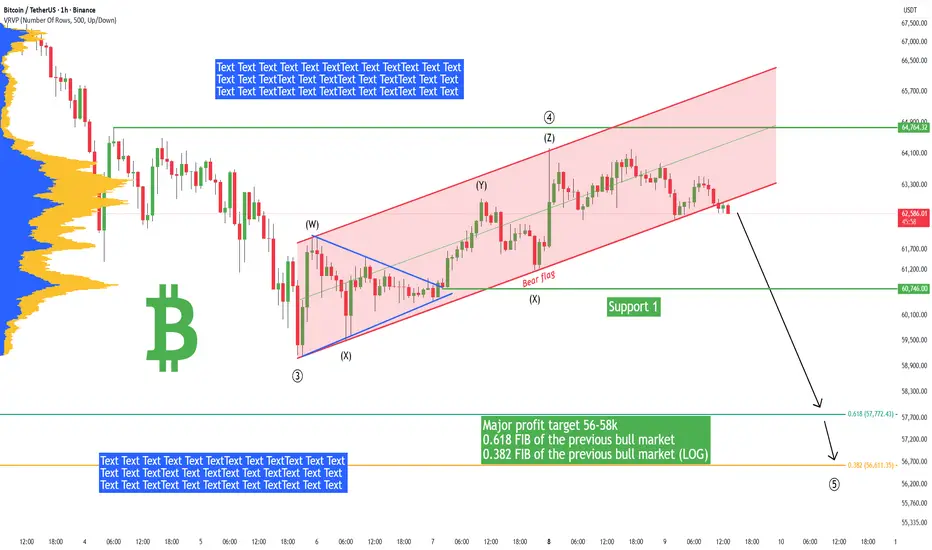
Bitcoin - Another drop starting! 57k target, then huge rallye!I believe Bitcoin is ready for another huge drop to 57k! I have the following reasons for this statement:
Bitcoin still didn't hit the major target 0.618 Fibonacci retracement of the previous bull market (2022-2025). It's like without this achievement, there is no way to go up.
Near this 0.618
NEAR Bullish Retest Continuation NEAR Protocol (NEAR) is currently displaying constructive price action after successfully flipping a key daily support level and confirming it with a bullish retest. This type of price behavior is often viewed as a positive technical signal, suggesting that previous resistance has now transitioned i
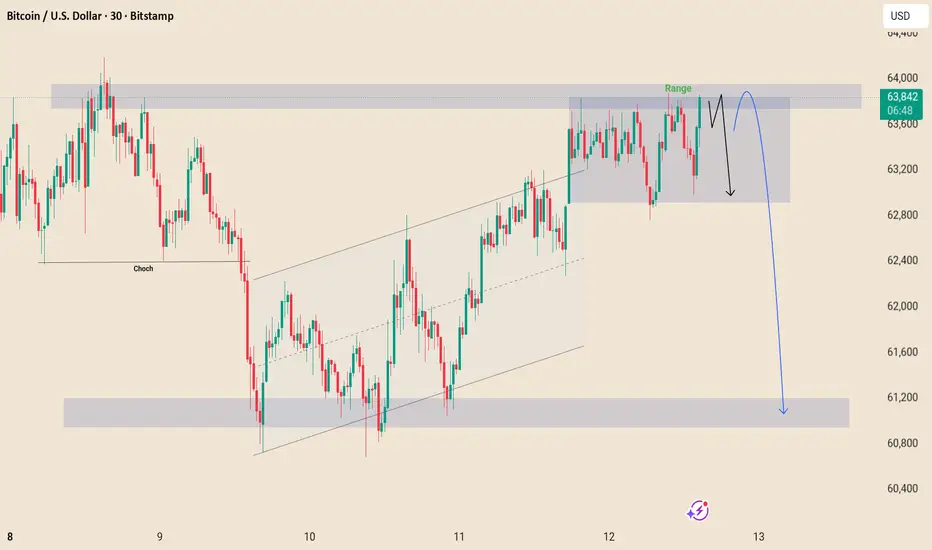
BTCUSD Range Resistance Signals Possible PullbackBitcoin is currently trading inside a well-defined resistance range after a strong bullish recovery from the ascending channel. Price has repeatedly tested the upper boundary of the range, indicating that buyers are struggling to achieve a decisive breakout.
As long as the resistance zone continues
XRP – Is History Repeating Itself?I'm comparing the current XRP cycle with the previous one to better estimate the timing of a potential bottom.
Back in the previous cycle, XRP first broke below a major support level and entered a prolonged correction phase.
What happened next? 👀
🔹 Price consolidated for more than 112 days
🔹 RSI

See all crypto ideas
Gold 30Min Engaged ( Bullish Reversal Detected )HANZO MARKET LIQUIDITY REPORT
Gold
Timeframe: 30min (Volume Basis)
Scale: Higher Timeframe Context / Deep Volume analysis
━━━━━━━━━━━━━━━━━━━━━━
Market Observation
This analysis is focusing on structural behavior, liquidity zones, Volume analysis
and key areas of interest within the current range.

Gold Isn’t Broken — It’s Being ManipulatedGold Isn’t Broken — It’s Being Manipulated
For the past two months, all the media is talking about the "Insider Trading" and no one is taking any further steps to stop this manipulation.
Every time Trump prepares to make a new war announcement, the price moves forward minutes, hours or 1 day in a

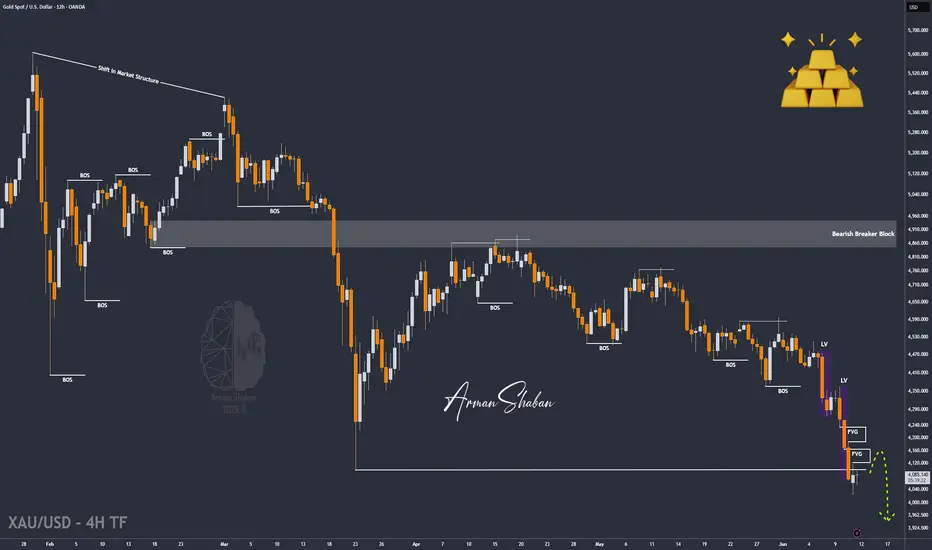
XAU/USD | Gold Breaks Below $4100 And Extends The Bearish Move!By analyzing the #Gold chart on the 4H timeframe, we can see that price once again followed the bearish scenario discussed in our previous update. Gold successfully reached the $4100 downside target and extended its decline even further, printing a fresh low around $4023 before rebounding modestly.
Gold Sheds 30% from Peak, Bitcoin Wipes Out 50%. Why So Serious?At first glance, these two should move opposite to one another. Inverse correlation. Unless, interest rates are involved.
Here’s how and why prospects of higher borrowing costs hurt both gold OANDA:XAUUSD and Bitcoin BITSTAMP:BTCUSD at the same time. The safe haven and the risk asset walk into
XAU/USD: The $4,023 Macro Wedge Spring📊 The Technical Blueprint
Gold is printing a massive structural capitulation pivot on the high-timeframe chart, currently trading at 4,090.877 on the 16-hour block. 📈 The multi-month markdown from the spring highs has officially driven the metal into a high-confluence terminal demand floor.
The Ape

XAUUSD Major Demand Zone | Bullish Reversal WatchGold remains under strong bearish pressure after breaking multiple support levels and confirming a bearish market structure. Price is now approaching a major demand zone near the recent strong low, where selling momentum may begin to weaken.
The highlighted demand area could attract buyers and supp
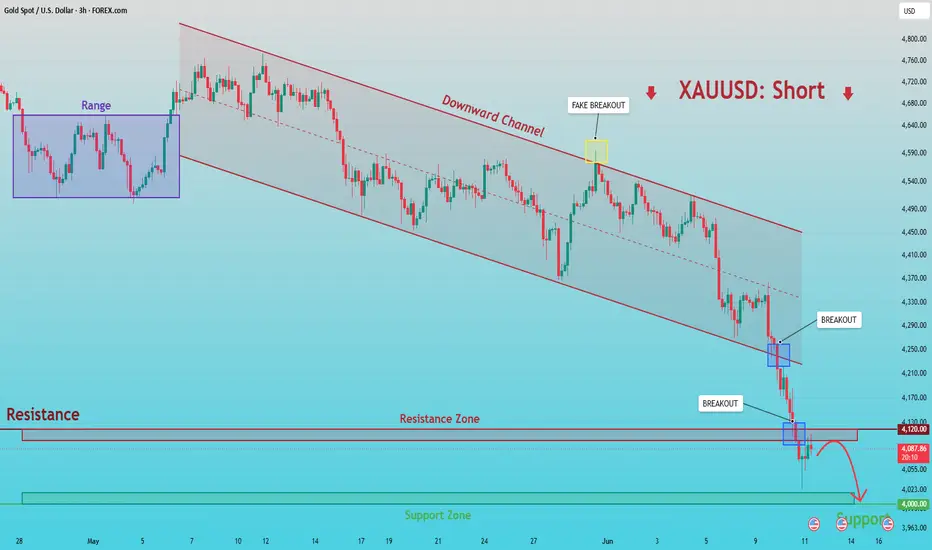
XAUUSD: Sellers Maintain Control and Opens Path Toward 4,000$Hello everyone, here is my breakdown of the current XAUUSD setup.
Market Analysis
XAUUSD has been trading inside a well-defined descending channel after breaking down from a broad consolidation range near the recent highs. Multiple bearish breakouts below key support levels confirmed strong selli
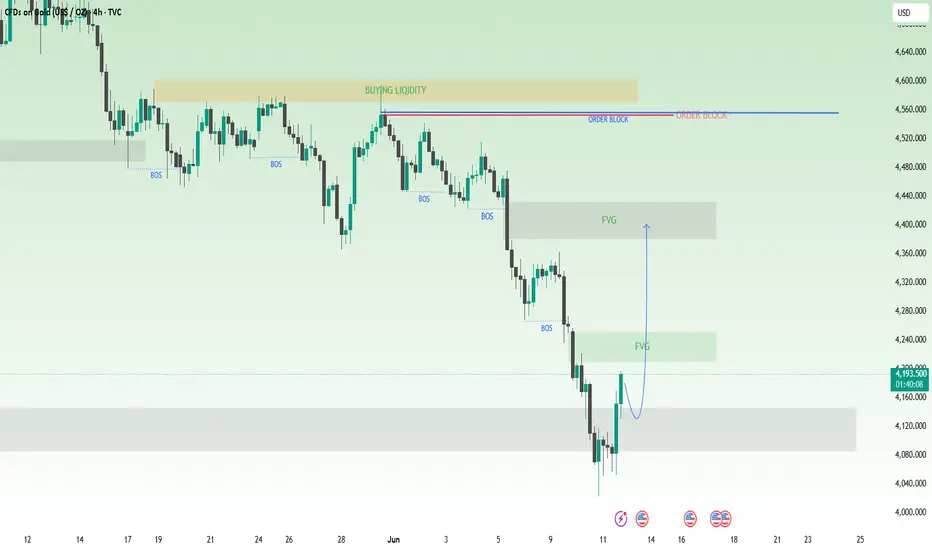
XAUUSD Falling Channel Breakout | Bulls Target 4175 & 4280 .📊 XAUUSD (30M Timeframe)
🔍 Analysis:
• Price has broken out of the falling channel ✅
• Buyers are defending the support zone around 4045–4070
• A bullish reversal structure is forming after a prolonged downtrend
• Holding above support could trigger a move toward higher resistance levels
🎯 Bullish

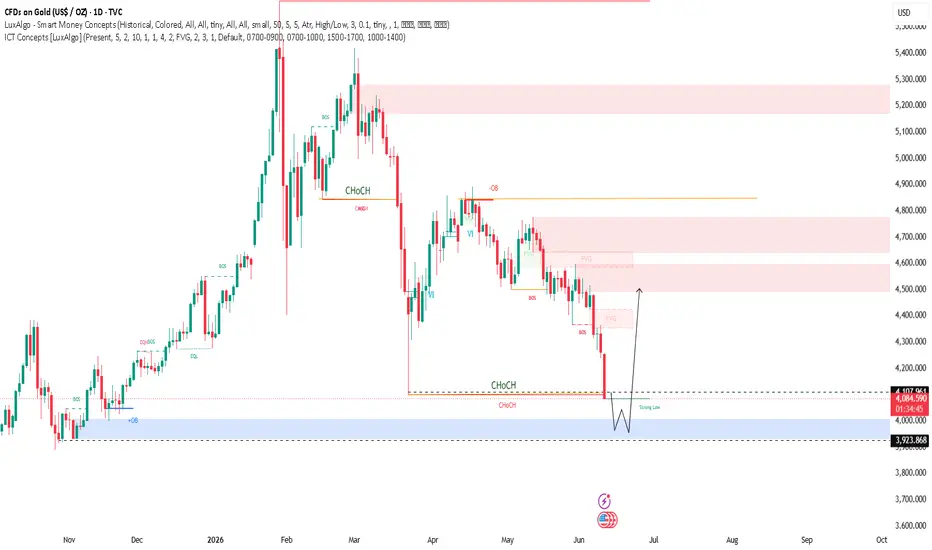
GOLD (XAUUSD) Daily | Potential Relief Rally to Fill Major FVGs1. Market Context & Structural Breakdown
Liquidity Hunt: The market swept buy-side liquidity ("BUYING LIQIDITY") near the 4,560 level before initiating a sharp, aggressive bearish expansion downward.
Bearish Momentum: Multiple bearish Breaks of Structure (BOS) confirmed strong seller dominance as p
XAUUSD (Gold) – Bearish Resistance Rejection SetupGold remains under bearish pressure after respecting a key resistance zone near 4110–4120. Price is currently trading below the resistance area while forming a rising trendline, suggesting a potential liquidity sweep before continuation to the downside.
The analysis highlights a possible rejection f

See all futures ideas
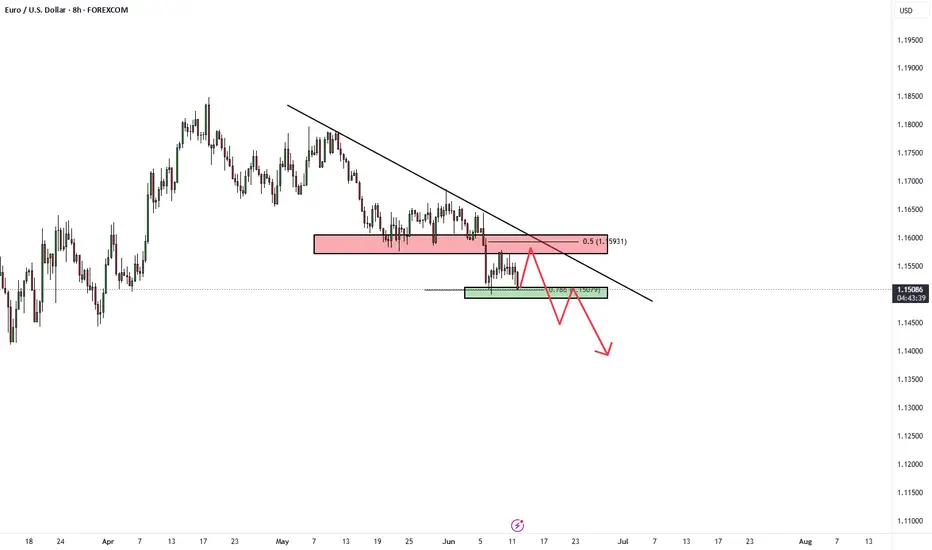
EURUSDHello Traders! 👋
What are your thoughts on EURUSD?
The EURUSD pair remains under selling pressure and continues to trade within a clear bearish structure. Price is holding below the descending trendline, which has capped upside attempts over recent weeks.
Following the breakdown of the key 1.1600
GBPUSD – Bearish Continuation Outlook📊 GBPUSD – Bearish Continuation Outlook
🔍 Market Overview
GBPUSD is showing renewed weakness after failing to sustain momentum near a key resistance zone. Multiple rejection signals around the supply area suggest that sellers remain active, while recent price action continues to form lower highs a

GBPNZD Weekly CLS Model 1Hi Friends, New CLS Range has been created and Im looking for short Model 1 trade setup. As always after the manipulation in to the Key Level, below the CLS range and reaction, we need to see a confirmation switch from the manipulation phase - CIOD (change in order flow) in the the expansion.
⏳

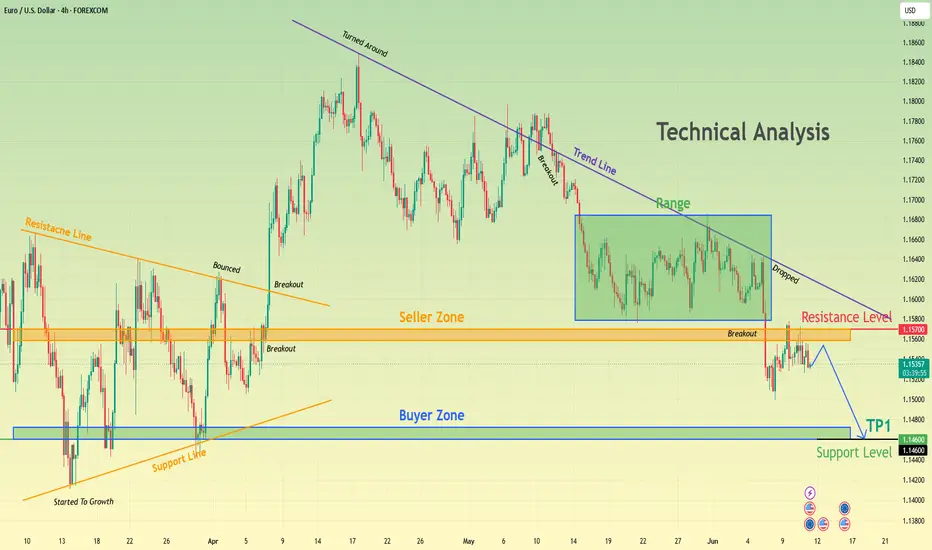
EURUSD Confirms Bearish Market Structure Below 1.1570 ResistanceHello traders! Here’s my technical outlook based on the current EURUSD (4H) chart structure. EURUSD previously traded above an ascending support line after breaking out from a long-term resistance trendline. Following a strong bullish advance, price reached a major turning point and reversed lower,
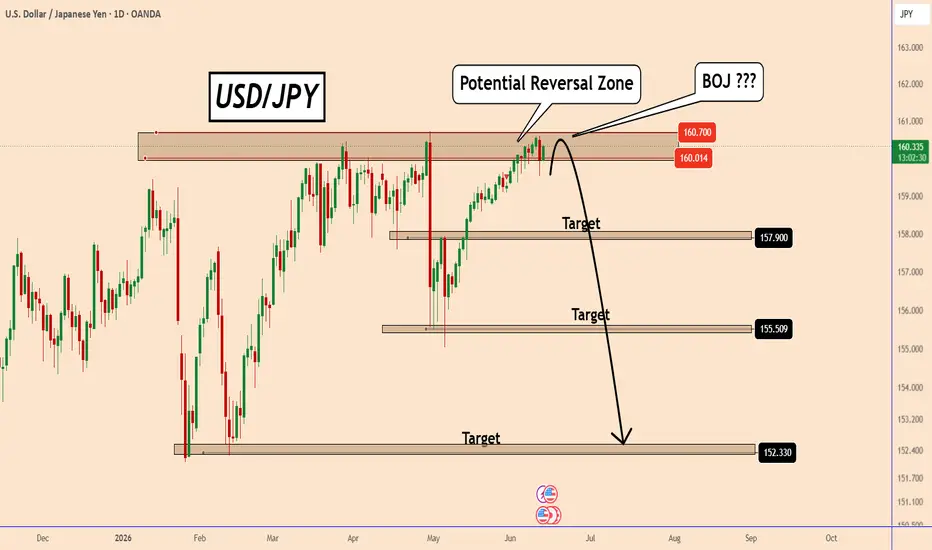
USDJPY at 160+: BOJ Silence Raises Intervention QuestionsUSDJPY at 160+: BOJ Silence Raises Intervention Questions
Back when USDJPY was below 160, they made a lot of comments about currency intervention.
In fact, we haven’t heard anything new from the BOJ for two weeks now that USDJPY is at 160.50 and has crossed their 160 threshold.
On Tuesday, June
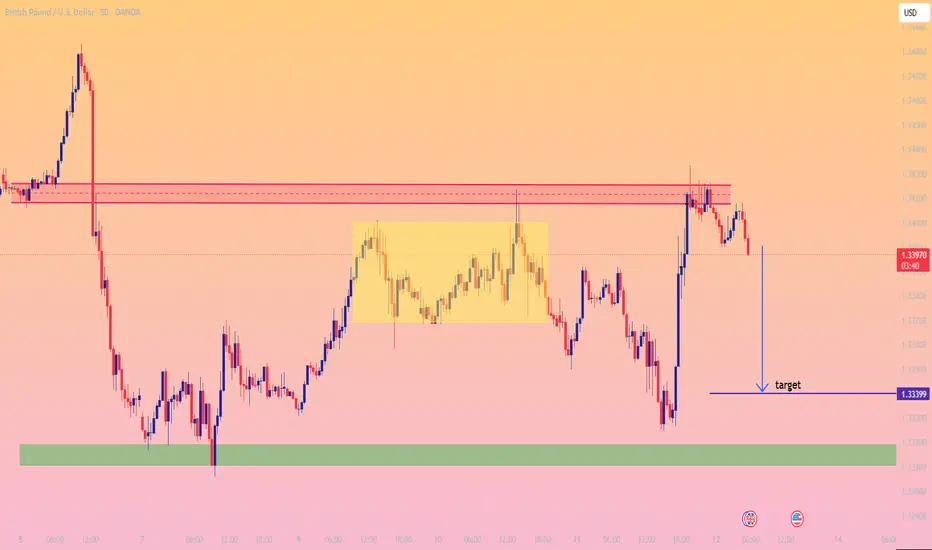
GBP/USD Bearish Rejection from Resistance – Downside Target in FGBP/USD is showing signs of weakness after rejecting a key resistance zone around **1.3418–1.3424**. Price rallied strongly into the highlighted supply area but failed to sustain the breakout, producing a bearish rejection and lower highs on the 30-minute timeframe.
The marked resistance zone has a
EURUSD Short: Bearish Structure Eyes 1.15200 Demand ZoneHello traders! Here’s my technical outlook based on the current EURUSD (2H) chart structure. EURUSD previously traded inside a descending channel and reached a major pivot point near the lower boundary. After breaking above the channel resistance, price formed a new consolidation structure between t

EURUSD Resistance at1.16000 as Hot CPI Boosts the US Dollar!Hey Traders,
In today's trading session, we are monitoring EURUSD for a potential selling opportunity around the 1.16000 zone. EURUSD is trading within a broader downtrend and is currently in a corrective phase, with price approaching the 1.16000 resistance area, a key support-turned-resistance lev

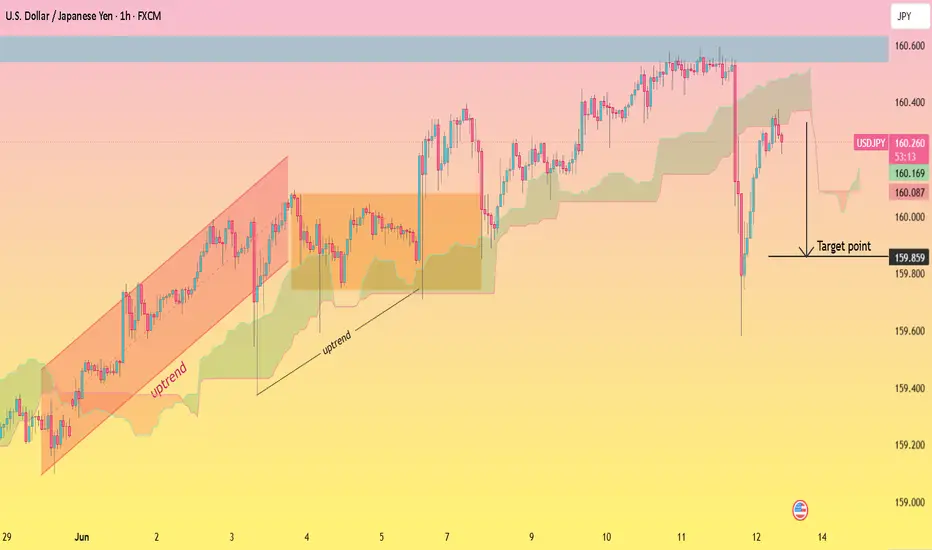
USD/JPY Bearish Retracement Toward Key Support ZoneUSD/JPY remains in a broader uptrend, but recent price action suggests a short-term bearish retracement may be developing. After reaching resistance near **160.60**, the pair faced strong selling pressure and produced a sharp rejection, indicating that buyers may be losing momentum.
The recovery bo
EURUSD - Consolidation before downward distributionFX:EURUSD maintains its medium-term bearish trend and may continue to decline against the backdrop of a strong DXY
The pair remains in consolidation within the 1.1500–1.1560 range as the market awaits the outcome of the ECB meeting, including the rate decision and Christine Lagarde's press con

See all forex ideas
Trade directly on Supercharts through our supported, fully-verified, and user-reviewed brokers.