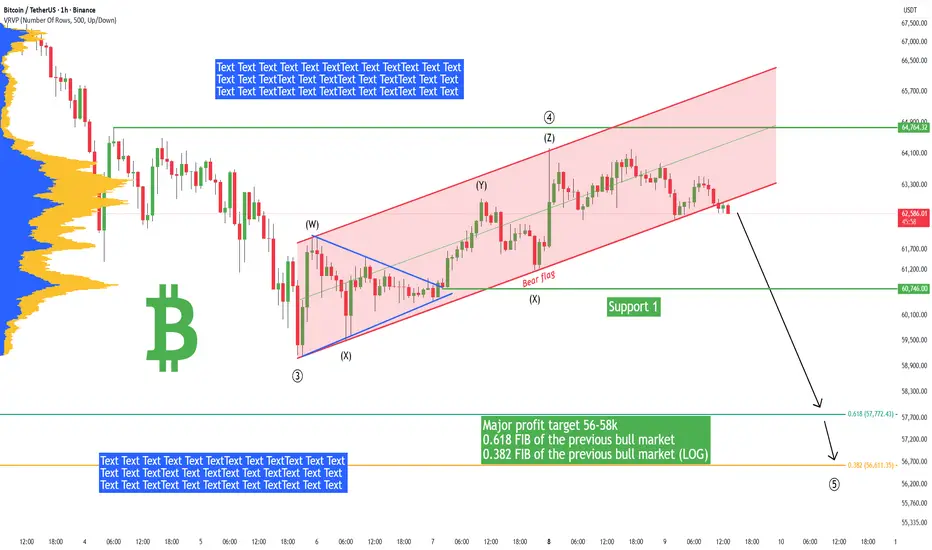
Bitcoin - Another drop starting! 57k target, then huge rallye!I believe Bitcoin is ready for another huge drop to 57k! I have the following reasons for this statement:
Bitcoin still didn't hit the major target 0.618 Fibonacci retracement of the previous bull market (2022-2025). It's like without this achievement, there is no way to go up.
Near this 0.618
About Bitcoin / TetherUS
Bitcoin, the first and most popular cryptocurrency, is known for its price volatility driven by institutional demand, regulations, and global events, while Tether (USDT) is widely used as a stable trading pair to avoid converting back to fiat. Together, Bitcoin and Tether play a central role in crypto markets, with Tether’s stability supporting Bitcoin trading and influencing investor behavior.
Related pairs
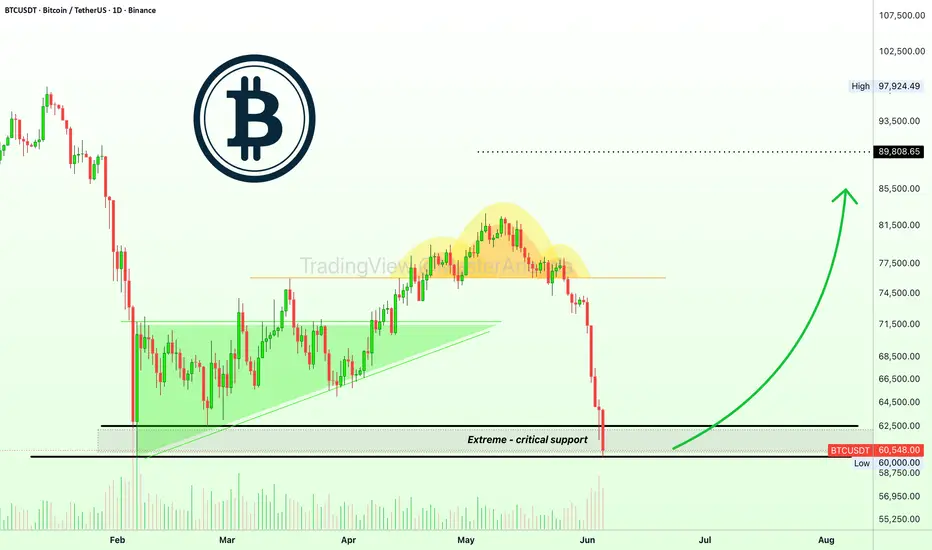
BTCUSDT – Bearish Breakdown Continuation📊 BTCUSDT – Bearish Breakdown Continuation
🔍 Market Overview
Bitcoin has experienced a strong bearish breakdown after failing to hold above a key descending trendline and major resistance zone. The sharp rejection from resistance confirms continued selling pressure, while market structure now favo

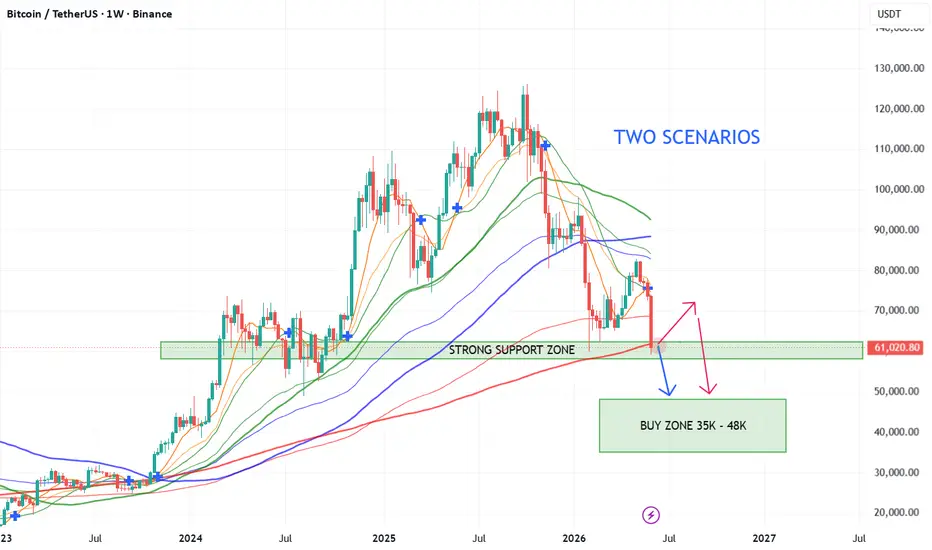
Bitcoin Is Testing the Floor — Not Starting a New Bull RunEveryone is waiting for the next Bitcoin bounce, but when I look at the weekly chart, I see something very different. BTC is currently sitting on a major support zone around 58k–62k USD, and this area is now under serious pressure. In the past, this zone acted as an important reaction area, but the
BTCUSDTHello Traders! 👋
What are your thoughts on Bitcoin ?
Bitcoin continues to trade within a well-defined descending channel. After reaching the major resistance zone around 82,000 and the upper boundary of the channel, price faced strong selling pressure and was rejected from that area.
Over the pas

Bitcoin bullish til 6-September 2026? Buy everything below 70KThe bullish move lasted 3 months, from 6-Feb to 6-May. The bearish move is about to be one month old and is ending now—from 6-May through 6-June.
» 6-June 2026 Bitcoin can turn bullish again. Buy everything below $70,000—think long-term.
A repeat of Feb-May would mean bullish action in June, Jul
Bitcoin - Why is everyone wrong + 48k in September! (must see)While the majority turned completely bullish at 82k, I remained sober and predicted this drop! Bitcoin is heading towards 48k in the next few weeks/months, so prepare for a huge crash. We will probably see a huge liquidation of retail traders and some of the popular exchanges. Your funds are definit

BTCUSDT: Recovery Attempt After Strong Downtrend, Eyes On 64KHello everyone, here is my breakdown of the current BTCUSDT setup.
Market Analysis
BTCUSDT previously traded inside a broad descending channel after reversing from a major high. Following a bearish breakout below the channel support, price accelerated lower and entered a strong impulsive decline,

Bitcoin Roadmap _ Short termBitcoin ( BINANCE:BTCUSDT ), in the past two days, began rising—albeit with weak momentum—gaining around +8%. One reason for the weak momentum is the weekend, which typically has low trading volume. However, at the start of the week, when the Iran-Israel conflict emerged, Bitcoin had a short-term ne

BTCUSDT: Signals Potential Upside From Demand Zone To 64KHello traders! Here’s my technical outlook based on the current BTCUSDT (2H) chart structure. BTCUSDT previously traded inside a broad consolidation range before breaking below support and starting a strong bearish trend. After the breakdown, price continued to decline beneath a descending trendline

BTCUSD Daily Outlook BOS Breakdown FVG Targets & Reversal ZONE
This chart illustrates a complete Smart Money Concepts (SMC) market cycle on the Bitcoin daily timeframe. Price initially formed a **Change of Character (CHoCH)** and **Break of Structure (BOS)**, signaling a shift from bearish to bullish market conditions. Following a period of consolidation with

See all ideas
Summarizing what the indicators are suggesting.
Oscillators
Neutral
SellBuy
Strong sellStrong buy
Strong sellSellNeutralBuyStrong buy
Oscillators
Neutral
SellBuy
Strong sellStrong buy
Strong sellSellNeutralBuyStrong buy
Summary
Neutral
SellBuy
Strong sellStrong buy
Strong sellSellNeutralBuyStrong buy
Summary
Neutral
SellBuy
Strong sellStrong buy
Strong sellSellNeutralBuyStrong buy
Summary
Neutral
SellBuy
Strong sellStrong buy
Strong sellSellNeutralBuyStrong buy
Moving Averages
Neutral
SellBuy
Strong sellStrong buy
Strong sellSellNeutralBuyStrong buy
Moving Averages
Neutral
SellBuy
Strong sellStrong buy
Strong sellSellNeutralBuyStrong buy
Displays a symbol's price movements over previous years to identify recurring trends.
Frequently asked questions
The current price of Bitcoin / TetherUS (BTC) is 63,558.77 USDT — it has risen 0.05% in the past 24 hours. Try placing this info into the context by checking out what coins are also gaining and losing at the moment and seeing BTC price chart.
Bitcoin / TetherUS price has fallen by −0.37% over the last week, its month performance shows a −20.93% decrease, and as for the last year, Bitcoin / TetherUS has decreased by −41.50%. See more dynamics on BTC price chart.
Keep track of coins' changes with our Crypto Coins Heatmap.
Keep track of coins' changes with our Crypto Coins Heatmap.
Bitcoin / TetherUS (BTC) reached its highest price on Oct 6, 2025 — it amounted to 126,199.63 USDT. Find more insights on the BTC price chart.
See the list of crypto gainers and choose what best fits your strategy.
See the list of crypto gainers and choose what best fits your strategy.
Bitcoin / TetherUS (BTC) reached the lowest price of 2,817.00 USDT on Sep 15, 2017. View more Bitcoin / TetherUS dynamics on the price chart.
See the list of crypto losers to find unexpected opportunities.
See the list of crypto losers to find unexpected opportunities.
The safest choice when buying BTC is to go to a well-known crypto exchange. Some of the popular names are Binance, Coinbase, Kraken. But you'll have to find a reliable broker and create an account first. You can trade BTC right from TradingView charts — just choose a broker and connect to your account.
Crypto markets are famous for their volatility, so one should study all the available stats before adding crypto assets to their portfolio. Very often it's technical analysis that comes in handy. We prepared technical ratings for Bitcoin / TetherUS (BTC): today its technical analysis shows the sell signal, and according to the 1 week rating BTC shows the sell signal. And you'd better dig deeper and study 1 month rating too — it's sell. Find inspiration in Bitcoin / TetherUS trading ideas and keep track of what's moving crypto markets with our crypto news feed.
Bitcoin / TetherUS (BTC) is just as reliable as any other crypto asset — this corner of the world market is highly volatile. Today, for instance, Bitcoin / TetherUS is estimated as 2.49% volatile. The only thing it means is that you must prepare and examine all available information before making a decision. And if you're not sure about Bitcoin / TetherUS, you can find more inspiration in our curated watchlists.
You can discuss Bitcoin / TetherUS (BTC) with other users in our public chats, Minds or in the comments to Ideas.