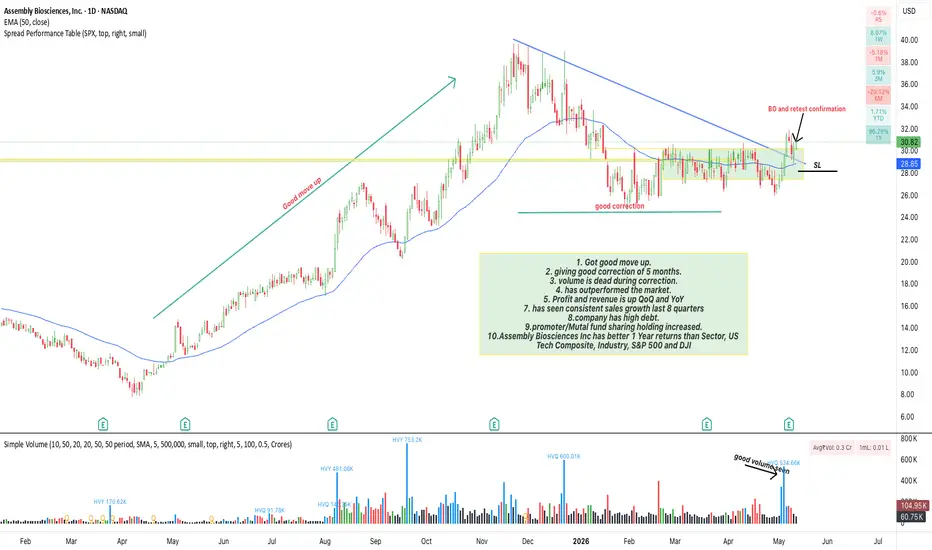
Assembly Biosciences Inc(ASMB) Analysis1. Got good move up.
2. giving good correction of 5 months.
3. volume is dead during correction.
4. has outperformed the market.
5. Profit and revenue is up QoQ and YoY
7. has seen consistent sales growth last 8 quarters
8.company has high debt.
9.promoter/Mutual fund sharing holding increased.
10.A

The best trades require research, then commitment.
Get started for free$0 forever, no credit card needed
Scott "Kidd" PoteetPolaris Dawn astronaut

Where the world does markets
Join 100 million traders and investors taking the future into their own hands.
Lost Decade for the S&P 500 coming?The fierce rally in the SP:SPX is rapidly approaching upper part of the century-old trend line, as well as a decade-and-half old trend line.
This is an extremely rare moment where the froth in the markets are at the dangerously high levels. If history patterns are to be believed, we may enter a

Ajanta Pharma (D): Bullish (Apex Squeeze & Pre-Breakout Setup)Timeframe: Daily | Scale: Linear
Ajanta Pharma is coiled in a massive compression zone, tightly squeezing against key historical resistance levels. Backed by excellent quarterly earnings and strong institutional accumulation, the probability of an upside breakout is highly elevated.
🚀 1. The Fun

Nifty at a Crucial Retest Zone: Bounce Back or Bigger Breakdown?Nifty is currently trading at one of the most important technical zones on the weekly timeframe. After facing rejection from the major resistance area near 26,000, the index witnessed a sharp correction and has now returned to its long-term rising support trendline. Interestingly, the previous suppo

Hindalco Exit / Potential Wave 5 of primary degree completion
Weekly chart
Wave (III) of cycle degree has been in progress since Feb 2016.
Wave 1 (primary degree)/Wave (III) was completed in Jan 2018
Wave 2 (primary degree)/Wave (III) was completed in Mar 2020 (Zigzag)
Wave 3 (primary degree)/Wave (III) was completed in Mar 2022
Wave 3 formed at 2.414 X of

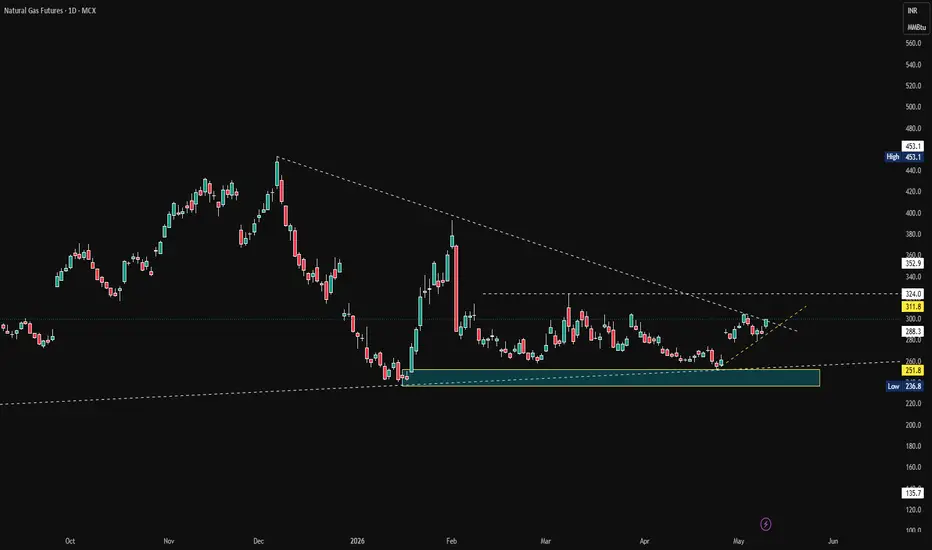
Natural gas mcxcrossing and closing strong day above 5 month downtrend line strong base made near 250 price range next resistance comes around 325 if manages to strong close above this levels can see big move in future towards 370-400 range in coming 3-4 month this is just view and not recommendation as NG next co
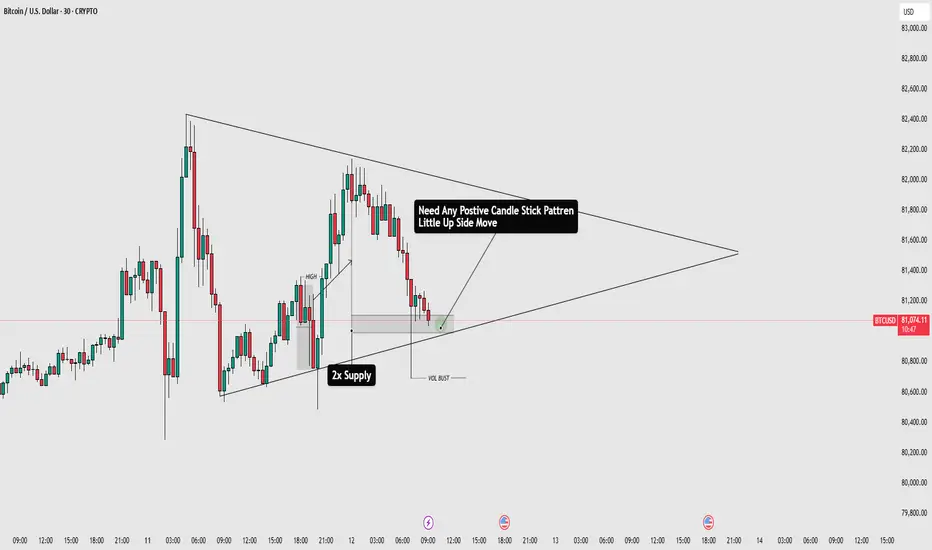
BTCUSD Pennant Structure | Waiting For FMFR SetupThe market is currently trapped inside a pennant structure, creating a compressed price range where both sides are active.
My main expectation here is an FMFR setup — First Move Fake Than Reversal. In this type of structure, the first breakout move is often a fake move before the market reverses st
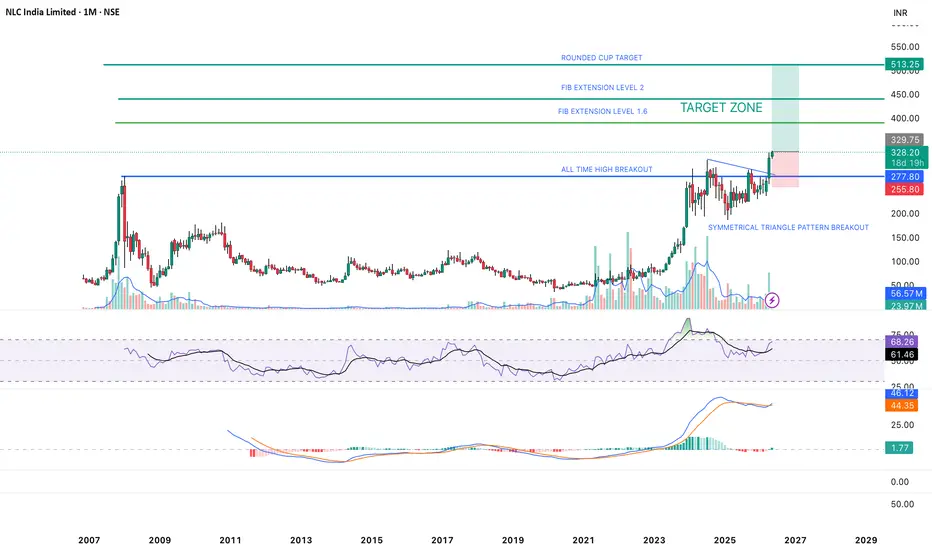
#NLC - ATH BREAKOUT WITH SYMMETRICAL TRIANGLE PATTERN FORMATION🚀 Trade Idea: NLC
📍 Setup: ATH BREAKOUT WITH SYMMETRICAL TRIANGLE FORMATION IN MONTHLY TIMEFRAME
⚡Setup Quality: A
📈 Entry: Above ₹328
🛑 SL: ₹260
🎯 Targets: ₹390 / ₹440 / ₹510
ALPHA SETUP RATING:
OVERALL MARKET SCORE: 19/25 NEUTRAL
PRICE ACTION SCORE: 23/25 BULLISH
VOLUME SCORE: 22/25 BULLISH
MOMEN
Nifty50 Short Term Analysis NSE:NIFTY 30 MIN CHART Analysis 📊
➖After Friday’s gap down opening, market spent the whole session in a tight range — showing clear indecision near important support zones.
👉Price is now trading near:
• Bull channel support
• 20 EMA Day TF
• 50 EMA Day TF
This creates a strong short-term suppor

Nifty - Weekly Review May 11 to May 15The price is moving within the range of 23900 to 24480. Wide range movement is hard to break as the price can consolidate in this range for many days, unless there is some news to move the market.
Buy above 24140 with the stop loss of 24080 for the targets 24180, 24240, 24300, 24360, 24440, 24500, 2

See all editors' picks ideas
Fractional EMA Kalman Filter [D7]Fractional EMA Kalman Filter
1. Description
Fractional EMA Kalman Filter is an experimental smoothing and state-estimation tool that combines a Kalman filter framework with a fractional EMA input. The objective is to create a filter that remains subdued during ranging conditions while retaini
Pine Script® indicator

Neural Weight Oscillator (Zeiierman)█ Overview
The Neural Weight Oscillator (Zeiierman) is an adaptive multi-factor oscillator that combines structured decision-making with dynamic market learning.
The script analyzes three core market behaviors: Trend, Mean Reversion, and Momentum. Instead of treating these components equally, t
Pine Script® indicator

NeuraLib: A Native AI and Deep Learning RuntimeNeuraLib is a tensor-based, auto-differentiating Machine Learning runtime built natively for Pine Script™.
It brings real Deep Learning mechanisms that power modern Artificial Intelligence systems into TradingView. Instead of relying on fixed formulas, static regressions, or rigid structures, Neur
Pine Script® library

Pine3D: A Native 3D Graphical Rendering EnginePine3D is a full 3D rendering engine for TradingView, powered by Pine Script™ v6.
Pine3D pushes forward the frontier of TradingView 3D rendering capabilities, providing a fully fledged graphical engine under an intuitive, chainable, object oriented API. Build meshes, transform them in world space,
Pine Script® library

TASC 2026.05 The AutoTune Filter█ OVERVIEW
This script implements the AutoTune Filter described by John F. Ehlers in the article "A Rolling Autocorrelation Function" from the May 2026 edition of the TASC Traders' Tips . The script analyzes rolling autocorrelation in filtered price data to calculate a band-pass filter that dyn
Pine Script® indicator

Smart Trader, Episode 06, Isotropic Trend Lines🔷 WHAT IS ST-EP06 — ISOTROPIC TREND LINES?
ST-EP06 is a multi-scale structural trend channel indicator built on a σ-normalized coordinate system. It is designed to solve one of the oldest unaddressed problems in technical analysis:
trend angles that cannot be compared across instruments, timef
Pine Script® indicator

AI Predictive Flow (Zeiierman)█ Overview
AI Predictive Flow (Zeiierman) is a pattern-based oscillator that estimates future price direction by comparing the current market state to similar historical conditions.
Instead of relying on traditional indicators like momentum or moving averages alone, the script builds a multi-fe
Pine Script® indicator

Focus Bars [Kioseff Trading]Hello Traders!
🔹 Focus Bars
Focus Bars is a lower-timeframe reconstruction tool designed to break each candle into a price-based internal structure .
Instead of viewing a bar as a single OHLC print, this tool redistributes intrabar participation across price levels, showing where activity, del
Pine Script® indicator

Carrier Volatility [Pumori]Carrier Volatility
This is the foundational Pulse component of the ET Massif Framework research suite.
Description
Pumori is a high-resolution volatility and impulse response tool built around an ultra-short fractional length (0.1 EMA). It is a high-frequency carrier framework that exposes the
Pine Script® indicator

Multi Timeframe Volume Profiles [TradingIQ]Hello Traders!
🔹 Multi-Timeframe Volume Profiles
Multi-Timeframe Volume Profiles is a visualization tool designed to show how volume and participation develop across multiple timeframes - all in one view.
Instead of switching between charts and trying to mentally piece together context, this to
Pine Script® indicator

See all indicators and strategies
Community trends
ADANIPOWER: Flag & Pole Continuation Setup on Daily Chart“Bullish Flag setup under observation.
Breakout above 234 may initiate continuation toward 293 based on measured move projection.
Volume confirmation and candle close above resistance will be key for validation.
Invalidation below 194.”
“This analysis is for educational purposes only and not financi

RELIANCE Weekly Stock Analysis — Simple & ClearRELIANCE INDUSTRIES
Weekly Stock Analysis — Simple & Clear
Week of 19 – 23 May 2026 | NSE: RELIANCE
Overall Bias: BEARISH | Last Close: ~₹1,360 | 52W Range: ₹1,290 – ₹1,611
Reliance Industries is India's largest private company. It runs businesses in petrol refining, Jio telecom, Reliance R

BUY TODAY SELL TOMORROW for 5%DON’T HAVE TIME TO MANAGE YOUR TRADES?
- Take BTST trades at 3:25 pm every day
- Try to exit by taking 4-7% profit of each trade
- SL can also be maintained as closing below the low of the breakout candle
Now, why do I prefer BTST over swing trades? The primary reason is that I have observed that

INFY | Infosys — Monthly Chart Analysis | May 2026 📊 INFY | Infosys — Monthly Chart Analysis | May 2026
"Distribution Complete — Where Does Price Go From Here?"
🔍 Structure Overview
After a massive rally from the pandemic lows (~₹509), Infosys formed a textbook Distribution Zone between ₹1,460–₹2,006 over nearly 3 years (2021–2024). The recent

#lichsgfin Ready for wealth building long term view Cup Formation
add above 599 for first ress 812
as trader use Sl 549
after completion of cup n handle
formation new level open

Inverted Head & Shoulder pattern in MOLDTKPAC A reversal chart pattern in the form of Inverted Head & Shoulder occurred in Moldtkpac
for study chart pattern

SunpharmaSUNPHARMA has given a strong breakout above the 1855 resistance zone on the 15-minute timeframe. Earlier, this level was acting as a strong supply area, but now price has successfully crossed and sustained above it, which indicates bullish strength.
The stock also formed a rounded bottom pattern, s

Hindalco Exit / Potential Wave 5 of primary degree completion
Weekly chart
Wave (III) of cycle degree has been in progress since Feb 2016.
Wave 1 (primary degree)/Wave (III) was completed in Jan 2018
Wave 2 (primary degree)/Wave (III) was completed in Mar 2020 (Zigzag)
Wave 3 (primary degree)/Wave (III) was completed in Mar 2022
Wave 3 formed at 2.414 X of
## Hindustan Copper Showing Inverse Head & Shoulders Formation |## Hindustan Copper Showing Inverse Head & Shoulders Formation | Bullish Structure Building
Hindustan Copper Ltd is showing signs of a potential bullish reversal on the daily timeframe with an emerging Inverse Head & Shoulders pattern formation.
Price has successfully taken support near the head z

HINDUNILVR Bullish Order Block Setup After Liquidity Sweep🔍 Key Observations
1.Liquidity sweep above highs completed
2.Rejection from bearish order block
3.Price approaching bullish OB
4.Potential bullish continuation setup
5.Daily timeframe structure remains reactive
📌 Trade Plan
Entry: Confirmation from bullish order block
Invalidation: Sustained close

See all stocks ideas
May 14
TMPVTata Motors Passenger Vehicles Ltd
Actual
15.70
INR
Estimate
10.31
INR
Today
MUTHOOTFINMuthoot Finance Ltd
Actual
76.89
INR
Estimate
69.74
INR
Today
DHAMPURSUGDhampur Sugar Mills Limited
Actual
—
Estimate
—
Today
INTLCONVInternational Conveyors Ltd.
Actual
—
Estimate
—
Today
SIYSILSiyaram Silk Mills Limited
Actual
—
Estimate
—
Today
SAILSteel Authority of India Limited
Actual
—
Estimate
4.30
INR
Today
CMSINFOCMS Info Systems Ltd.
Actual
—
Estimate
—
Today
GALAXYSURFGalaxy Surfactants Ltd.
Actual
—
Estimate
20.25
INR
See more events
Community trends
(BTCUSDT.P) 45-Min — Curved Distribution Into Reversal ZoneMarket gives the bullish momentum when the (curve line) breaks
The current market structure on the 45-minute chart suggests that BTC is completing a classic curved distribution pattern, where price gradually loses bullish momentum before accelerating into a liquidation-driven selloff.
What makes t

BTCUSD FMFR Setup Inside Parallel ChannelThe market is currently trading inside a parallel channel structure, and price action is showing weakening demand over time. Buyers are gradually losing momentum, while supply is entering the market more aggressively and with stronger reactions.
At the moment, the overall structure remains range-bo

PREDICTION ON BTCUSD 30 MIN TFThe chart is showing a corrective bullish retracement inside a broader bearish environment. Price initially respected the ascending support trendline, but after the strong sell-off from the previous resistance zone, market structure shifted into a more cautious and distribution-based phase.
The cur

BTCUSD Facing H1 Resistance: Bearish Rejection at OB ?Key Technical Observations:
Descending Channel Breakout: Price action previously moved within a tight descending channel (highlighted in orange). While it broke out to the upside, it is now encountering heavy supply.
H1 Order Block (H1-OB): Price has rallied into a highlighted bearish Order Block

Bitcoin chart analysis May 13Hello
It's a Bitcoin Guide.
My analysis is optimized for TradingView.
If you press the Replay button, you can check real-time movements.
This is the Bitcoin 30-minute chart.
A MACD Dead Cross is currently in progress on the Nasdaq 12-hour chart.
It appears the direction will be determined by to

eth next zone to see price to tap and respect these areaeth next zone to see price to tap and respect these area according to my analsysis eth next zone to see price to tap and respect these area according to my analsysiseth next zone to see price to tap and respect these area according to my analsysiseth next zone to see price to tap and respect the

ZEC/USDT — 15% 4H Countertrend Short SetupZEC is showing signs of short-term exhaustion after an aggressive vertical expansion move. Price is currently reacting inside a higher timeframe supply zone while momentum begins cooling following the recent impulsive rally.
The setup focuses on a possible mean reversion move back toward the reclai


BTCUSD 1HChart Concept & Observation :
The highlighted box in this chart represents a potential support and resistance zone, where price has historically reacted and may continue to do so.
If any bullish or bearish price action pattern / candlestick formation appears near the upper or lower boundary of

SOL Approaching Key Support — Long Swing Setup SOL is now approaching an important support zone around $91–$92, and this area could provide a good opportunity for a long swing setup. Price has pulled back, but if buyers defend this level, we may see a recovery move toward the next resistance zones.
Trading Levels:
Entry Zone: $91 – $92
Take Pr

See all crypto ideas
BULLISH GOLDXAUUSD 4H Trendline Breakout Setup ✨
XAUUSD is currently testing a strong 4-hour trendline resistance after spending several sessions in a consolidation phase. Price action is showing signs of building bullish momentum, and the market could be preparing for a breakout move if buyers continue to sta

XAUUSD 4H Analysis - ICT Liquidity PerspectiveXAUUSD 4H Analysis — ICT Liquidity Perspective
Gold appears to be shifting bearish after sweeping external liquidity near the 4740–4772 region. The market engineered a sell-side liquidity raid followed by bearish displacement and a market structure shift near 4613.
Current observations:
• Lower hi

Gold todayIn 4H time frame market sidewise
In 15 minute market need to sweep below LQ.
After sweep market get support 4666
If market break the area (BOS) 4637 we plan shot entries

XAUUSD - Buyers Still Hold the Key ZoneThe price had previously been moving within a clear downward channel, indicating strong control from the sellers over a prolonged period. However, after reacting strongly at the lower support zone, XAUUSD formed a reversal pattern and then broke above the BOS zone, signaling a shift in market moment

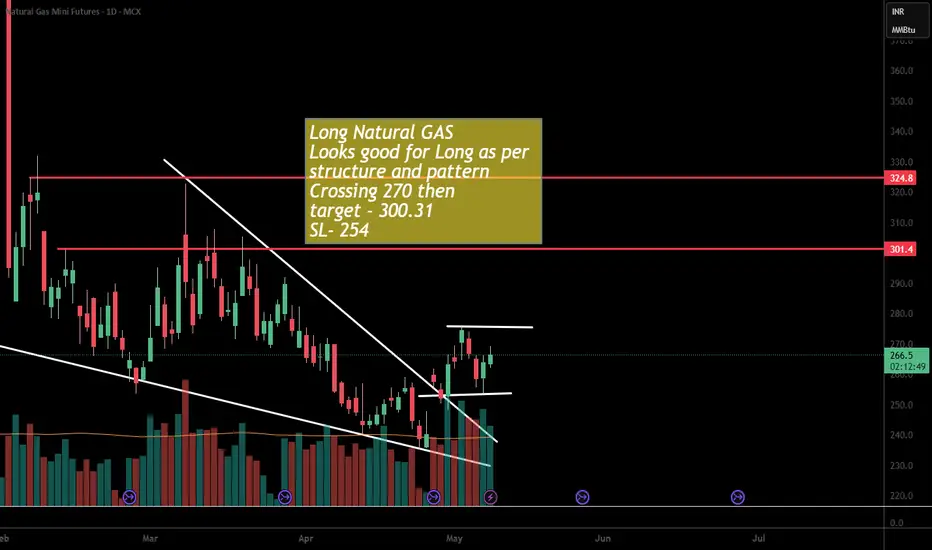
Long NaturalgasNaturalgas looks good for Long as per gann cycle and structure pattern.
If it cross 270 and sustain then we can see move near 300
SL 254
XAU/USD: The $4,720 Breakout Trigger | Full RoadmapThe current market sentiment for XAU/USD (Gold Spot / US Dollar) is showing a neutral-to-consolidative tone with a slight bullish bias as of May 14, 2026. Gold is currently trading around $4,697 - $4,700, navigating a complex landscape of sticky US inflation and shifting geopolitical dynamics.
Curr

Technical Analysis Ellipse Formation: XAU/USD (1-Hour Chart)
Pattern Formation: Price action exhibits a prolonged consolidation phase inside a large Ellipse structure.
Immediate Support: A local horizontal support block sits near 4,680.00, keeping short-term buyers active.
Central Zone: A significant structural target is plotted at 4,765.00 just outside t

XAUUSD Holding Above Bullish Trendline.Gold (XAUUSD) is trading above the bullish trendline, showing that buyers are still controlling the short-term market direction. Price reacted strongly from the 4668 support level and moved higher with bullish momentum, confirming that demand is still active in the market.
As long as price remains

XAUUSD 1H: Bearish Pressure Building Below Key ResistanceGold continues to trade under strong resistance after failing to reclaim the bearish FVG zone on the 1H timeframe. Price is currently consolidating below the supply area while showing weak bullish continuation, suggesting that sellers are still maintaining short-term control.
The repeated rejection

GIFTY Suggest 600-700 Points Rally in Nifty in next 2 WeeksGIFTY Hourly chart Suggest 600-700 Points Rally in Nifty in next 2 Weeks.
We can see Bottom formation done on GIFTY charts & it can trace back to 24500+ Level by May Expiry.
LTP - 23850
Targets - 24500+
Timeframe - 2 Weeks.
Happy Investing.

See all futures ideas
GU BULLISH IDEAPrice has taken in the liquidity which is previous day low and also prices mitigating 4h order block and it’s also Wednesday, so I am expecting price to reverse from this point and go take the high that I have marked as target!
IT CAN GO DEEPIN NYO SO MANAGEACCORDINGLY I MIGHT ADD MORE POSITIONS!

GBPUSD Slightly Lower, but Market Sentiment Remains Strong!From a technical standpoint, the price is currently navigating within an ascending wedge pattern, and I anticipate this trend to continue, with a key target near 1.365.
The price is respecting the established channel, and the 1.365 level stands as a critical juncture—where a pullback or a continuati

GBP/USD Continues to Under Pressure Due to UK FundamentalsGBP/USD traded with a negative bias below 1.3550 during today's Asian session.
The combination of political turmoil in London and higher-than-expected US inflation data has created a perfect storm for the pound, leaving it vulnerable to a retest of the psychological 1.3500 level.
✅ UK Politics: Ke

AUDCAD: Corrective Dip May Fuel Next Rally
AUDCAD on the 1H chart is still trading within a corrective structure after the strong rally to the 0.9930 high. Instead of continuing higher immediately, the price began moving within a falling channel, indicating that momentum has slowed in the short term. The current structure looks more like

EURUSD Weakens Below Key SupportEURUSD continues to decline after breaking below EMA34 and EMA89. Price is currently trading near 1.1650, while strong bearish momentum confirms sellers remain in control.
The key support at 1.1700 has already been broken decisively. If price stays below this zone, EURUSD could continue falling tow

EUR/USD 45M Inverse Head & Shoulders Retest Setup – Bullish ReveKey Technical Observations
1. Inverse Head & Shoulders Formation
The marked swing structure suggests:
Left Shoulder: Around May 13
Head: Deeper low near 1.1690
Right Shoulder: Current retest zone near 1.1705–1.1710
This pattern usually signals:
seller exhaustion,
accumulation,
and a potential bu

USDCHF Multi Time-Frame Analysis Hi traders, this is the multi-time frame analysis for this pair. Please feel free to ask any questions in the comment section below. The entry will only be made if all strategy rules are met.

EURUSD: Bearish Orderflow Continuing From PremiumPrice continues to respect bearish orderflow after reacting from premium arrays and internal liquidity.
Current framework:
Clear H1 bearish displacement
Retracement into imbalance and premium zone completed
Price rejecting lower-timeframe supply
Sell-side liquidity resting below current structure

EURUSD Rejection From Resistance ZoneEURUSD is approaching a key resistance area near 1.1790 after a strong bullish recovery, but price is now showing signs of exhaustion inside the premium zone. Multiple rejections near resistance suggest buyers are struggling to maintain momentum while sellers begin stepping into the market.
The asc

GBPUSD Reversal Zone In FocusThe market is currently approaching an important reversal zone where I am waiting for a strong positive candle confirmation. A clean bullish reaction from this area could trigger a solid upside move.
Looking at the structure, the previous high was successfully broken first. After the breakout, I co

See all forex ideas
Trade directly on Supercharts through our supported, fully-verified, and user-reviewed brokers.