Institutional Master classOption Trading Basics
Call vs Put Options Detailed
In-the-Money (ITM), At-the-Money (ATM), Out-of-the-Money (OTM)
Options Greeks: Delta, Gamma, Theta, Vega, Rho – controlling price sensitivity.
Understanding Option Premium Breakup
Option Strategies
Single-Leg Strategies: Buying Calls, Buying
About S&P BSE Sensex Index
S&P BSE SENSEX is a stock index that tracks the performance of the 30 largest and most liquid companies listed on the Bombay Stock Exchange (BSE) that operate in the key sectors of the Indian economy. As a market capitalization-weighted index, first compiled in 1986, BSE Index serves as a powerful tool for investors to watch the movements of the Indian stock market.
Related indices

Sensex - Expiry day analysis July 8Price moved within a narrow range 83262 to 83516. Did not show any trend strength and did not try to break the range.
Price have to sustain above 83520 to be bullish. 83000 is a strong support zone.
Buy above 83520 with the stop loss 83400 for the targets 83600, 83720, 83860, 83980, 84100 and 84200.

SENSEX INTRADAY LEVELS ( EDUCATIONAL PURPOSE ) 09/07/2025🔹 SENSEX Intraday Trade Plan – 9 July
📊 Analysis: 15-min TF | Execution: 1-min TF
🔵 GAP-UP Opening (Above 83,750)
📌 Plan: Avoid chasing the gap. Look for reversal or a retest
🔁 Entry: Sell below 5-min breakdown or rejection from 83,750–83,800
🛑 SL: 25–30 pts above high
🎯 Target: 83,580 – 83,500
🔻

SENSEX INDEX INTRADAY LEVELS ( EDUCATIONAL PURPOSE) 11/07/2025📉 Sensex Intraday Trade Plan – 11 July (Friday)
🕒 Chart: 5-min/15-min | Trading TF: 1-minute
🔽 Market Context:
Strong downward momentum from 83,800 zone
Lower highs forming; near 83,150 support
Today’s opening crucial — at support or breaking it
🔼 GAP-UP Opening (Above 83,200)
✅ BUY on breakout ab

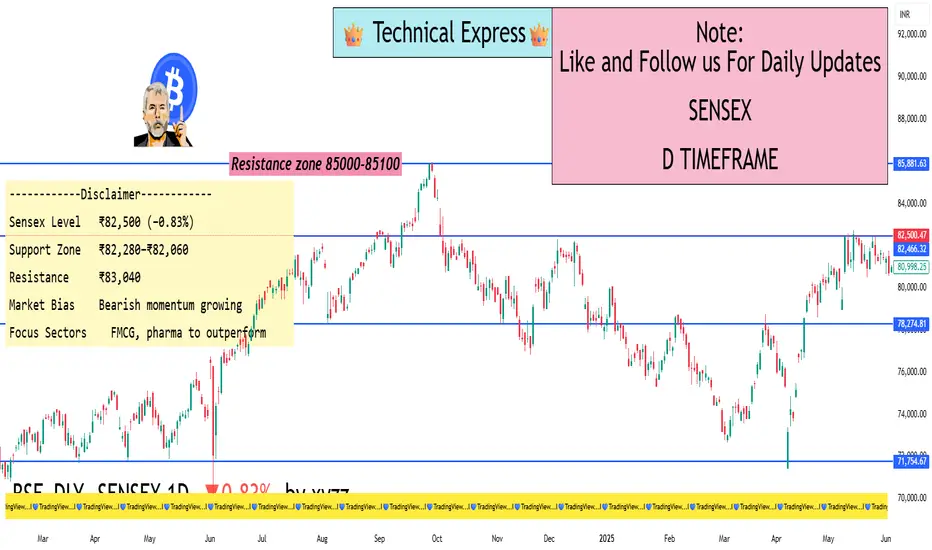
Sensex Dives Below ₹82,600 — IT Stocks Drag Index DownFrom a technical standpoint, Sensex breaking below ₹82,600 is important. This was seen as a short-term support level. Now that it's broken, ₹82,280 and ₹82,060 are the next zones to watch for.
Moving Averages:
Sensex has slipped below its 20-day moving average, which is often used as a trend indic
Institutional TradingDivergence Trading
Divergence trading is a technical strategy based on the observation that asset prices and their related indicators (like RSI, MACD, etc.) sometimes move in opposite directions.
Types of Divergence:
Regular Divergence: Predicts potential trend reversals.
Hidden Divergence: Sugg

Sensex - Expiry day analysis July 1Trend deciding zone is 83500. And also now price is at the lower trend line of the channel from here price can bounce or break the channel.
Buy above 83600 with the stop loss of 83480 for the targets 83700, 83820, 83940, 84060 and 84200.
Sell below 83380 with the stop loss of 83500 for the targets 8

Institutional TradingInstitutional Investment Process
Setting Objectives: Determining risk tolerance, return targets, and time horizons.
Asset Allocation: Dividing the portfolio among different asset classes.
Security Selection: Choosing individual investments.
Portfolio Monitoring: Continuously reviewing performanc

Institutional Option Trading Part -3Institutional Investment Process
Setting Objectives: Determining risk tolerance, return targets, and time horizons.
Asset Allocation: Dividing the portfolio among different asset classes.
Security Selection: Choosing individual investments.
Portfolio Monitoring: Continuously reviewing performanc


See all ideas
Summarizing what the indicators are suggesting.
Oscillators
Neutral
SellBuy
Strong sellStrong buy
Strong sellSellNeutralBuyStrong buy
Oscillators
Neutral
SellBuy
Strong sellStrong buy
Strong sellSellNeutralBuyStrong buy
Summary
Neutral
SellBuy
Strong sellStrong buy
Strong sellSellNeutralBuyStrong buy
Summary
Neutral
SellBuy
Strong sellStrong buy
Strong sellSellNeutralBuyStrong buy
Summary
Neutral
SellBuy
Strong sellStrong buy
Strong sellSellNeutralBuyStrong buy
Moving Averages
Neutral
SellBuy
Strong sellStrong buy
Strong sellSellNeutralBuyStrong buy
Moving Averages
Neutral
SellBuy
Strong sellStrong buy
Strong sellSellNeutralBuyStrong buy
Displays a symbol's price movements over previous years to identify recurring trends.
Frequently Asked Questions
The current value of S&P BSE Sensex Index is 82,266.63 INR — it has fallen by −0.83% in the past 24 hours. Track the index more closely on the S&P BSE Sensex Index chart.
S&P BSE Sensex Index reached its highest quote on Sep 27, 2024 — 85,978.25 INR. See more data on the S&P BSE Sensex Index chart.
The lowest ever quote of S&P BSE Sensex Index is 113.28 INR. It was reached on Dec 14, 1979. See more data on the S&P BSE Sensex Index chart.
S&P BSE Sensex Index value has decreased by −0.97% in the past week, since last month it has shown a 0.03% increase, and over the year it's increased by 2.71%. Keep track of all changes on the S&P BSE Sensex Index chart.
The top companies of S&P BSE Sensex Index are BSE:RELIANCE, BSE:HDFCBANK, and BSE:TCS — they can boast market cap of 235.40 B INR, 176.99 B INR, and 137.49 B INR accordingly.
The highest-priced instruments on S&P BSE Sensex Index are BSE:ULTRACEMCO, BSE:MARUTI, and BSE:LT — they'll cost you 12,551.65 INR, 12,548.85 INR, and 3,524.00 INR accordingly.
The champion of S&P BSE Sensex Index is BSE:BHARTIARTL — it's gained 32.33% over the year.
The weakest component of S&P BSE Sensex Index is BSE:INDUSINDBK — it's lost −39.48% over the year.
S&P BSE Sensex Index is just a number that lets you track performance of the instruments comprising the index, so you can't invest in it directly. But you can buy S&P BSE Sensex Index futures or funds or invest in its components.
The S&P BSE Sensex Index is comprised of 30 instruments including BSE:RELIANCE, BSE:HDFCBANK, BSE:TCS and others. See the full list of S&P BSE Sensex Index components to find more opportunities.